467 N Dugan Rd Urbana, OH 43078
Estimated Value: $480,000 - $693,000
2
Beds
1
Bath
2,084
Sq Ft
$300/Sq Ft
Est. Value
About This Home
This home is located at 467 N Dugan Rd, Urbana, OH 43078 and is currently estimated at $625,125, approximately $299 per square foot. 467 N Dugan Rd is a home located in Champaign County with nearby schools including Urbana Elementary School, Urbana High School, and Urbana Community School.
Ownership History
Date
Name
Owned For
Owner Type
Purchase Details
Closed on
Feb 21, 2025
Sold by
Smith Connie and Smith Connie L
Bought by
Connie L Smith Trust and Smith
Current Estimated Value
Purchase Details
Closed on
Nov 11, 2024
Sold by
Under Trust Agreement With Beth Burchena and Baechtold William J
Bought by
Smith Connie
Purchase Details
Closed on
Oct 11, 2006
Sold by
Jones Beth B and Jones Donald E
Bought by
Burchenal Burchenal Ralph R Ralph R and Burchenal Jones Beth
Purchase Details
Closed on
May 4, 2006
Sold by
Taylor Louis E and Taylor Trust
Bought by
Jones Beth B
Create a Home Valuation Report for This Property
The Home Valuation Report is an in-depth analysis detailing your home's value as well as a comparison with similar homes in the area
Home Values in the Area
Average Home Value in this Area
Purchase History
| Date | Buyer | Sale Price | Title Company |
|---|---|---|---|
| Connie L Smith Trust | -- | None Listed On Document | |
| Connie L Smith Trust | -- | None Listed On Document | |
| Smith Connie | -- | None Listed On Document | |
| Smith Connie | -- | None Listed On Document | |
| Burchenal Burchenal Ralph R Ralph R | -- | None Available | |
| Jones Beth B | $375,000 | None Available |
Source: Public Records
Tax History Compared to Growth
Tax History
| Year | Tax Paid | Tax Assessment Tax Assessment Total Assessment is a certain percentage of the fair market value that is determined by local assessors to be the total taxable value of land and additions on the property. | Land | Improvement |
|---|---|---|---|---|
| 2024 | $7,996 | $187,010 | $21,300 | $165,710 |
| 2023 | $7,996 | $187,010 | $21,300 | $165,710 |
| 2022 | $8,157 | $187,010 | $21,300 | $165,710 |
| 2021 | $7,426 | $149,600 | $17,030 | $132,570 |
| 2020 | $7,424 | $149,600 | $17,030 | $132,570 |
| 2019 | $7,337 | $149,600 | $17,030 | $132,570 |
| 2018 | $5,050 | $98,150 | $16,510 | $81,640 |
| 2017 | $5,017 | $98,150 | $16,510 | $81,640 |
| 2016 | $5,030 | $98,150 | $16,510 | $81,640 |
| 2015 | $5,038 | $95,200 | $16,510 | $78,690 |
| 2014 | $5,043 | $95,200 | $16,510 | $78,690 |
| 2013 | $4,330 | $95,200 | $16,510 | $78,690 |
Source: Public Records
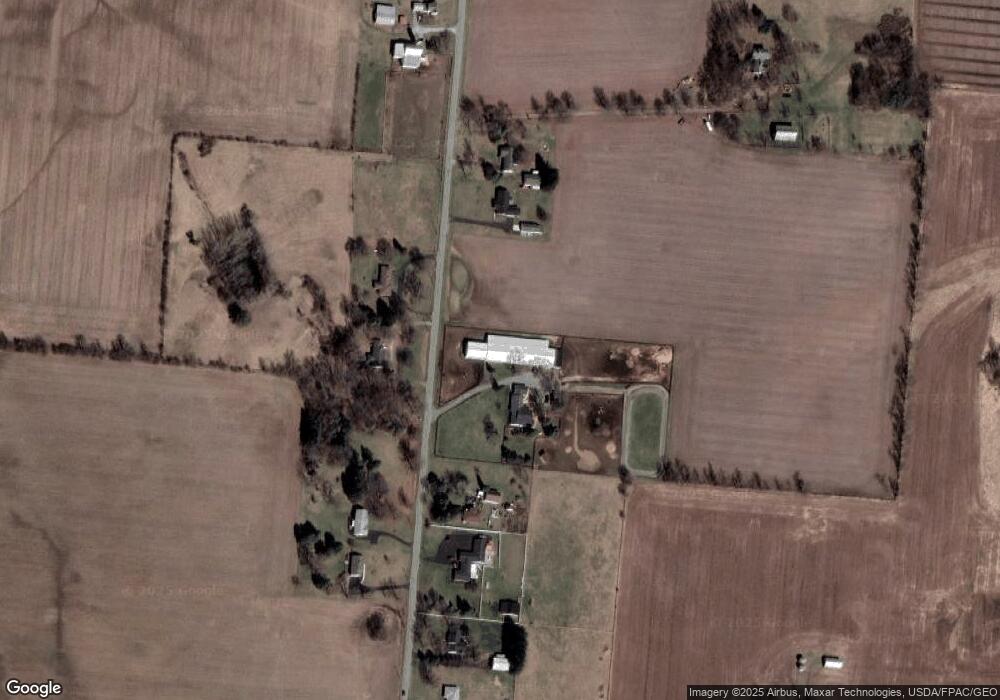
Map
Nearby Homes