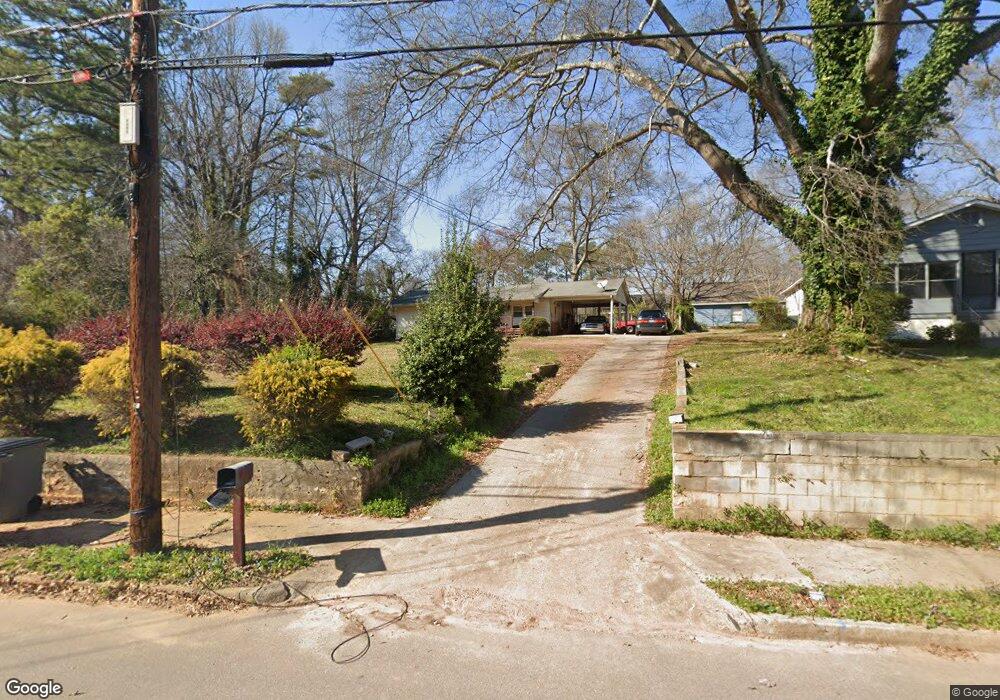
467 Oak Dr Atlanta, GA 30354
Estimated Value: $207,000 - $242,000
2
Beds
1
Bath
982
Sq Ft
$230/Sq Ft
Est. Value
About This Home
This home is located at 467 Oak Dr, Atlanta, GA 30354 and is currently estimated at $225,820, approximately $229 per square foot. 467 Oak Dr is a home located in Fulton County with nearby schools including Hapeville Elementary School, Paul D. West Middle School, and Tri-Cities High School.
Ownership History
Date
Name
Owned For
Owner Type
Purchase Details
Closed on
Feb 12, 2020
Sold by
James Forrest K
Bought by
Echeverria Jorge Luis Gomez
Current Estimated Value
Purchase Details
Closed on
Apr 28, 2006
Sold by
Whisenant Lonnie B
Bought by
James Forrest K
Home Financials for this Owner
Home Financials are based on the most recent Mortgage that was taken out on this home.
Original Mortgage
$79,920
Interest Rate
6.28%
Mortgage Type
New Conventional
Purchase Details
Closed on
Sep 22, 1999
Sold by
Gonzalez Antonio
Bought by
Gonzalez Antonio and Gonzalez Gloria
Create a Home Valuation Report for This Property
The Home Valuation Report is an in-depth analysis detailing your home's value as well as a comparison with similar homes in the area
Home Values in the Area
Average Home Value in this Area
Purchase History
| Date | Buyer | Sale Price | Title Company |
|---|---|---|---|
| Echeverria Jorge Luis Gomez | $124,900 | -- | |
| James Forrest K | $99,900 | -- | |
| Gonzalez Antonio | -- | -- |
Source: Public Records
Mortgage History
| Date | Status | Borrower | Loan Amount |
|---|---|---|---|
| Previous Owner | James Forrest K | $79,920 |
Source: Public Records
Tax History Compared to Growth
Tax History
| Year | Tax Paid | Tax Assessment Tax Assessment Total Assessment is a certain percentage of the fair market value that is determined by local assessors to be the total taxable value of land and additions on the property. | Land | Improvement |
|---|---|---|---|---|
| 2025 | $1,632 | $79,160 | $24,760 | $54,400 |
| 2023 | $2,631 | $93,200 | $30,280 | $62,920 |
| 2022 | $2,184 | $83,000 | $38,640 | $44,360 |
| 2021 | $2,141 | $49,960 | $20,800 | $29,160 |
| 2020 | $1,161 | $56,280 | $21,600 | $34,680 |
| 2019 | $704 | $53,680 | $8,560 | $45,120 |
| 2018 | $1,034 | $52,440 | $8,360 | $44,080 |
| 2017 | $348 | $20,480 | $4,880 | $15,600 |
| 2016 | $347 | $20,480 | $4,880 | $15,600 |
| 2015 | $522 | $20,480 | $4,880 | $15,600 |
| 2014 | $349 | $20,480 | $4,880 | $15,600 |
Source: Public Records
Map
Nearby Homes