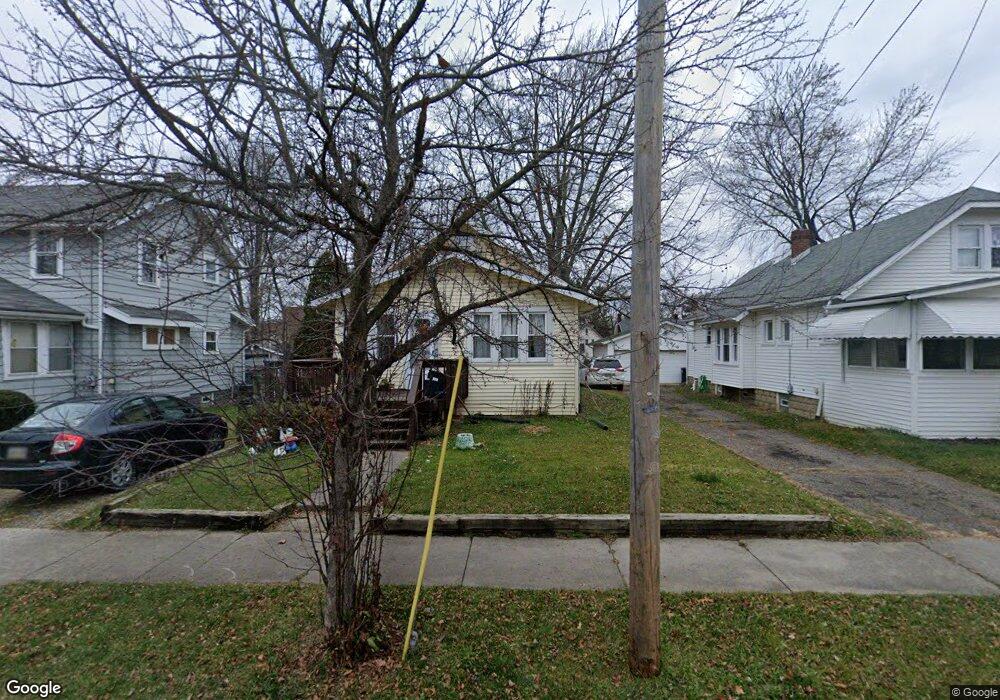
467 Rexford St Akron, OH 44314
Kenmore NeighborhoodEstimated Value: $97,130 - $131,000
2
Beds
1
Bath
764
Sq Ft
$142/Sq Ft
Est. Value
About This Home
This home is located at 467 Rexford St, Akron, OH 44314 and is currently estimated at $108,283, approximately $141 per square foot. 467 Rexford St is a home located in Summit County with nearby schools including St. Francis de Sales School and Sam Salem Community Learning Center.
Ownership History
Date
Name
Owned For
Owner Type
Purchase Details
Closed on
Jan 21, 2020
Sold by
Jordan Ray N
Bought by
Equity Trust Company and Fbo Melissa Rossetti Ira
Current Estimated Value
Purchase Details
Closed on
Mar 12, 2012
Sold by
Wagner Donna J
Bought by
Jordan Ray N
Home Financials for this Owner
Home Financials are based on the most recent Mortgage that was taken out on this home.
Original Mortgage
$27,993
Interest Rate
3.86%
Mortgage Type
Future Advance Clause Open End Mortgage
Purchase Details
Closed on
Sep 23, 2010
Sold by
Wagner Donna J
Bought by
Wagner Donna J and The Donna J Wagner Revocable Trust
Purchase Details
Closed on
May 11, 2006
Sold by
Wagner Donna J
Bought by
Jordan Ray N
Home Financials for this Owner
Home Financials are based on the most recent Mortgage that was taken out on this home.
Original Mortgage
$37,500
Interest Rate
8%
Mortgage Type
Seller Take Back
Create a Home Valuation Report for This Property
The Home Valuation Report is an in-depth analysis detailing your home's value as well as a comparison with similar homes in the area
Home Values in the Area
Average Home Value in this Area
Purchase History
| Date | Buyer | Sale Price | Title Company |
|---|---|---|---|
| Equity Trust Company | $22,000 | None Available | |
| Jordan Ray N | $42,500 | Attorney | |
| Wagner Donna J | -- | Attorney | |
| Jordan Ray N | $42,500 | Approved Statewide Title Age |
Source: Public Records
Mortgage History
| Date | Status | Borrower | Loan Amount |
|---|---|---|---|
| Previous Owner | Jordan Ray N | $27,993 | |
| Previous Owner | Jordan Ray N | $37,500 |
Source: Public Records
Tax History Compared to Growth
Tax History
| Year | Tax Paid | Tax Assessment Tax Assessment Total Assessment is a certain percentage of the fair market value that is determined by local assessors to be the total taxable value of land and additions on the property. | Land | Improvement |
|---|---|---|---|---|
| 2025 | $1,906 | $29,610 | $8,050 | $21,560 |
| 2024 | $1,906 | $29,610 | $8,050 | $21,560 |
| 2023 | $1,906 | $29,610 | $8,050 | $21,560 |
| 2022 | $1,933 | $18,365 | $4,911 | $13,454 |
| 2021 | $1,835 | $18,365 | $4,911 | $13,454 |
| 2020 | $1,892 | $18,000 | $4,910 | $13,090 |
| 2019 | $1,567 | $13,250 | $4,560 | $8,690 |
| 2018 | $2,432 | $13,250 | $4,560 | $8,690 |
| 2017 | $1,643 | $13,250 | $4,560 | $8,690 |
| 2016 | $1,643 | $14,250 | $4,910 | $9,340 |
| 2015 | $1,643 | $14,250 | $4,910 | $9,340 |
| 2014 | $1,634 | $14,250 | $4,910 | $9,340 |
| 2013 | $1,654 | $14,840 | $4,910 | $9,930 |
Source: Public Records
Map
Nearby Homes
- 2365 Pelton Ave
- 364 Rexford St
- 363 Lockwood St
- 355 Lockwood St
- 2531 Pelton Ave
- 451 Allenford St
- 2513 Christensen Ave
- 590 Flora Ave
- 636 Flora Ave
- 2785 Nesmith Lake Blvd
- 2303 6th St SW
- 2323 11th St SW
- 2238 7th St SW
- 2332 11th St SW
- 2199 6th St SW
- 2291 11th St SW
- 2186 5th St SW
- 55 W Ralston Ave
- 41 W Woodsdale Ave
- 75 W Dartmore Ave
- 463 Rexford St
- 473 Rexford St
- 457 Rexford St
- 477 Rexford St
- 478 Lockwood St
- 482 Lockwood St
- 470 Lockwood St
- 466 Lockwood St
- 486 Lockwood St
- 451 Rexford St
- 462 Rexford St
- 478 Rexford St
- 462 Lockwood St
- 487 Rexford St
- 492 Lockwood St
- 482 Rexford St
- 456 Rexford St
- 458 Lockwood St
- 445 Rexford St
- 486 Rexford St