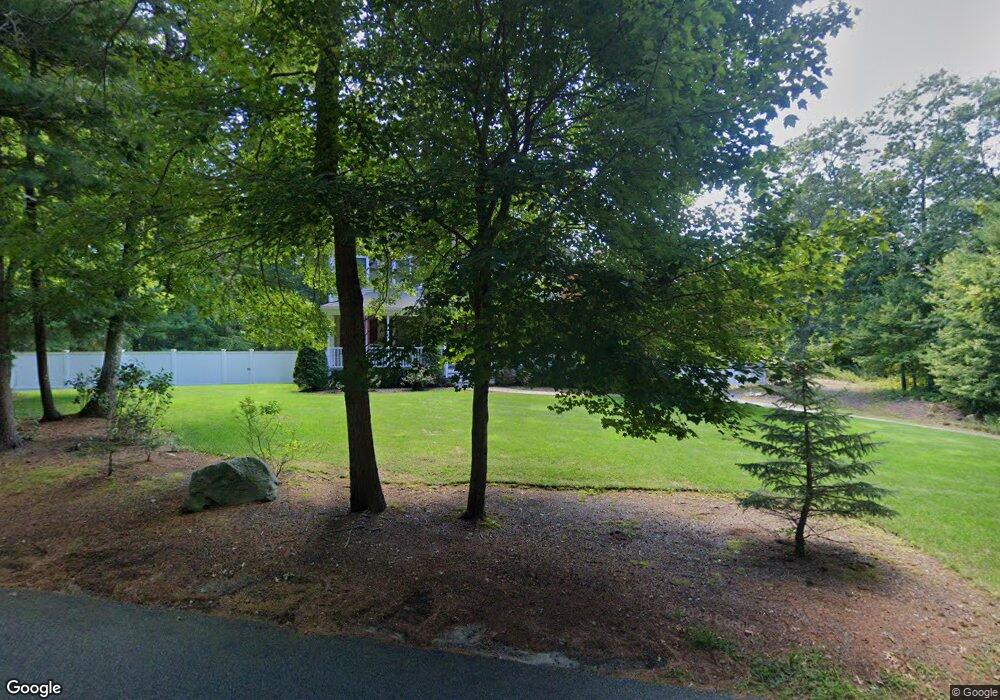
467 S Worcester St Unit 1 Norton, MA 02766
Estimated Value: $875,276 - $1,033,000
4
Beds
3
Baths
3,400
Sq Ft
$283/Sq Ft
Est. Value
About This Home
This home is located at 467 S Worcester St Unit 1, Norton, MA 02766 and is currently estimated at $961,319, approximately $282 per square foot. 467 S Worcester St Unit 1 is a home located in Bristol County with nearby schools including J.C. Solmonese Elementary School, Henri A. Yelle Elementary School, and Norton Middle School.
Ownership History
Date
Name
Owned For
Owner Type
Purchase Details
Closed on
Aug 21, 2014
Sold by
Medeiros Octavio and Medeiros Claire
Bought by
Medeiros Ft and Medeiros Octavio
Current Estimated Value
Purchase Details
Closed on
Nov 3, 2010
Sold by
Bank Of Canton
Bought by
Medeiros Octavio and Medeiros Claire
Home Financials for this Owner
Home Financials are based on the most recent Mortgage that was taken out on this home.
Original Mortgage
$360,000
Interest Rate
4.41%
Mortgage Type
Purchase Money Mortgage
Purchase Details
Closed on
Apr 15, 2010
Sold by
Bank Of Canton
Bought by
Bank Of Canton
Purchase Details
Closed on
Mar 28, 2007
Sold by
Ribeiro Ent Inc
Bought by
Sierra Dev Llp
Home Financials for this Owner
Home Financials are based on the most recent Mortgage that was taken out on this home.
Original Mortgage
$489,200
Interest Rate
6.33%
Mortgage Type
Purchase Money Mortgage
Create a Home Valuation Report for This Property
The Home Valuation Report is an in-depth analysis detailing your home's value as well as a comparison with similar homes in the area
Home Values in the Area
Average Home Value in this Area
Purchase History
| Date | Buyer | Sale Price | Title Company |
|---|---|---|---|
| Medeiros Ft | -- | -- | |
| Medeiros Octavio | $460,000 | -- | |
| Bank Of Canton | $440,000 | -- | |
| Sierra Dev Llp | $236,550 | -- |
Source: Public Records
Mortgage History
| Date | Status | Borrower | Loan Amount |
|---|---|---|---|
| Previous Owner | Medeiros Octavio | $360,000 | |
| Previous Owner | Sierra Dev Llp | $489,200 |
Source: Public Records
Tax History Compared to Growth
Tax History
| Year | Tax Paid | Tax Assessment Tax Assessment Total Assessment is a certain percentage of the fair market value that is determined by local assessors to be the total taxable value of land and additions on the property. | Land | Improvement |
|---|---|---|---|---|
| 2025 | $107 | $826,500 | $183,700 | $642,800 |
| 2024 | $10,304 | $795,700 | $175,000 | $620,700 |
| 2023 | $9,854 | $758,600 | $165,000 | $593,600 |
| 2022 | $9,560 | $670,400 | $150,000 | $520,400 |
| 2021 | $9,098 | $609,400 | $142,900 | $466,500 |
| 2020 | $8,842 | $597,400 | $138,700 | $458,700 |
| 2019 | $7,955 | $533,900 | $126,400 | $407,500 |
| 2018 | $7,853 | $518,000 | $126,400 | $391,600 |
| 2017 | $7,677 | $499,500 | $126,400 | $373,100 |
| 2016 | $7,337 | $470,000 | $126,400 | $343,600 |
| 2015 | $7,119 | $462,600 | $123,600 | $339,000 |
| 2014 | $6,830 | $444,400 | $117,700 | $326,700 |
Source: Public Records
Map
Nearby Homes
- 25 Wintergreen Ln
- 198 Taunton Ave Unit A
- 198 Taunton Ave Unit B
- 196 Taunton Ave Unit B
- 51 Cobb Brook
- 3 Jeffrey Ln
- 470 Hodges St
- 3 Gilberts Way
- Lot 8 Joel Harvey Way
- 38 Danielle St
- 115 Ice House Rd
- 15 Alcott Cir Unit D3
- 125 John Scott Blvd
- 127 John Scott Blvd
- 48 Dean St
- 152 Pine St Unit 23
- 166 Alfred Lord Blvd
- 4 Colonial Dr Unit 4
- Lot 6 Tremont St
- 75 Barrows St
- 467 S Worcester St
- 466 S Worcester St
- 0 S Worcester St - Rear
- 465 S Worcester St
- 462 S Worcester St
- 468 S Worcester St
- 460 S Worcester St
- 475 S Worcester St
- 470 S Worcester St
- 469 S Worcester St
- 472 S Worcester St
- 464 S Worcester St
- 458 S Worcester St
- 456 S Worcester St
- 474 S Worcester St
- 478 S Worcester St
- 476 S Worcester St
- 63 Eddy St
- 455 S Worcester St
- 58 Eddy St