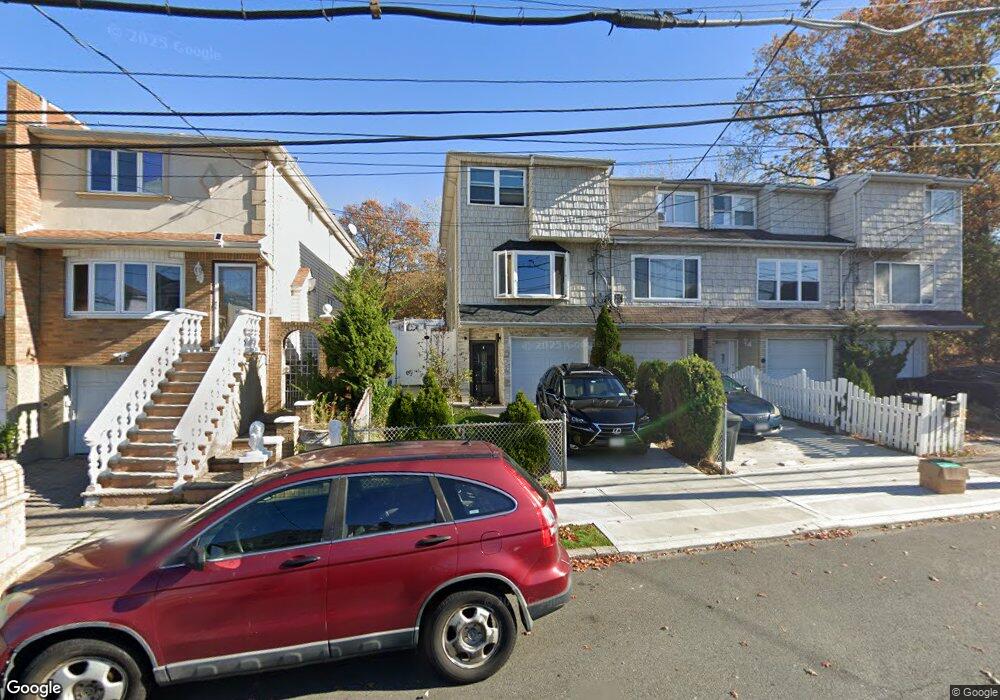
467 van Name Ave Staten Island, NY 10303
Graniteville NeighborhoodEstimated Value: $564,690 - $616,000
2
Beds
3
Baths
1,764
Sq Ft
$331/Sq Ft
Est. Value
About This Home
This home is located at 467 van Name Ave, Staten Island, NY 10303 and is currently estimated at $584,673, approximately $331 per square foot. 467 van Name Ave is a home located in Richmond County with nearby schools including P.S. 22 Graniteville, I.S. 51 Edwin Markham, and Port Richmond High School.
Ownership History
Date
Name
Owned For
Owner Type
Purchase Details
Closed on
Jul 16, 2009
Sold by
Burgos Luis and Burgos Cynthia
Bought by
Berthold Renee
Current Estimated Value
Home Financials for this Owner
Home Financials are based on the most recent Mortgage that was taken out on this home.
Original Mortgage
$307,232
Outstanding Balance
$203,252
Interest Rate
5.58%
Mortgage Type
FHA
Estimated Equity
$381,421
Purchase Details
Closed on
Feb 20, 2007
Sold by
Evans Deborah
Bought by
Burgos Luis and Burgos Cynthia
Home Financials for this Owner
Home Financials are based on the most recent Mortgage that was taken out on this home.
Original Mortgage
$240,000
Interest Rate
6.3%
Mortgage Type
Purchase Money Mortgage
Purchase Details
Closed on
Jan 15, 1999
Sold by
Caygoz Okan and Caygoz Semia
Bought by
Evans Deborah
Home Financials for this Owner
Home Financials are based on the most recent Mortgage that was taken out on this home.
Original Mortgage
$133,950
Interest Rate
6.73%
Create a Home Valuation Report for This Property
The Home Valuation Report is an in-depth analysis detailing your home's value as well as a comparison with similar homes in the area
Home Values in the Area
Average Home Value in this Area
Purchase History
| Date | Buyer | Sale Price | Title Company |
|---|---|---|---|
| Berthold Renee | $312,900 | The Judicial Title Insurance | |
| Burgos Luis | $365,000 | Old Republic National Title | |
| Evans Deborah | $141,000 | Fidelity National Title Ins |
Source: Public Records
Mortgage History
| Date | Status | Borrower | Loan Amount |
|---|---|---|---|
| Open | Berthold Renee | $307,232 | |
| Previous Owner | Burgos Luis | $240,000 | |
| Previous Owner | Evans Deborah | $133,950 |
Source: Public Records
Tax History Compared to Growth
Tax History
| Year | Tax Paid | Tax Assessment Tax Assessment Total Assessment is a certain percentage of the fair market value that is determined by local assessors to be the total taxable value of land and additions on the property. | Land | Improvement |
|---|---|---|---|---|
| 2025 | $5,171 | $31,500 | $6,186 | $25,314 |
| 2024 | $5,171 | $30,660 | $5,996 | $24,664 |
| 2023 | $5,208 | $25,644 | $5,914 | $19,730 |
| 2022 | $4,830 | $26,640 | $7,140 | $19,500 |
| 2021 | $4,803 | $27,660 | $7,140 | $20,520 |
| 2020 | $4,814 | $25,260 | $7,140 | $18,120 |
| 2019 | $4,488 | $24,180 | $7,140 | $17,040 |
| 2018 | $4,356 | $21,370 | $6,357 | $15,013 |
| 2017 | $4,110 | $20,161 | $6,364 | $13,797 |
| 2016 | $3,802 | $19,020 | $7,140 | $11,880 |
| 2015 | $3,431 | $18,952 | $5,241 | $13,711 |
| 2014 | $3,431 | $17,880 | $5,940 | $11,940 |
Source: Public Records
Map
Nearby Homes
- 257 Maple Pkwy
- 336 van Name Ave
- 317 Van Pelt Ave
- 51 Adrianne Ln
- 22 Spirit Ln Unit 37
- 38 Eleanor Place
- 12 Doreen Dr
- 268 Bruckner Ave Unit 268
- 335 Simonson Ave
- 15 Ludwig Ln
- 73 Westbrook Ave
- 331 Union Ave
- 49 Doreen Dr
- 33 Ludwig Ln
- 339 Lake Ave
- 21 Carol Place
- 5 Ludwig Ln Unit B
- 128 Bruckner Ave
- 964 Richmond Ave
- 22 Confederation Place
- 469 van Name Ave
- 465 van Name Ave
- 471 van Name Ave
- 463 van Name Ave
- 473 van Name Ave
- 463A van Name Ave
- 466 van Name Ave
- 468 van Name Ave
- 453 van Name Ave
- 464 van Name Ave
- 470 van Name Ave
- 462 van Name Ave
- 460 van Name Ave
- 478 van Name Ave
- 458 van Name Ave
- 451 van Name Ave
- 456 van Name Ave
- 480 van Name Ave
- 480 van Name Ave Unit 1+2
- 454 van Name Ave