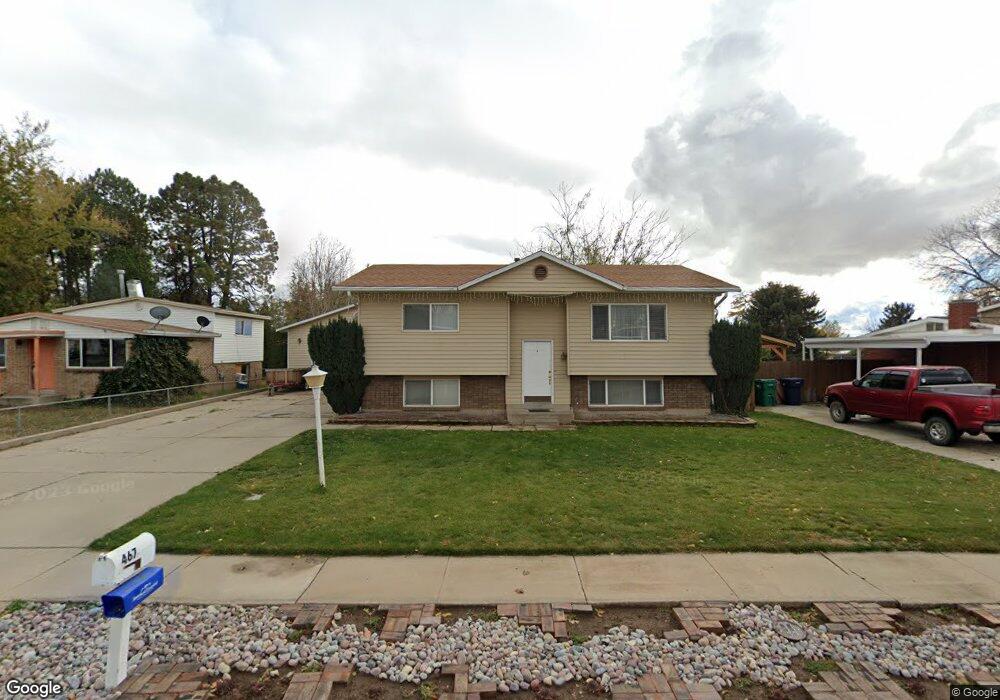
467 W 100 N Layton, UT 84041
Estimated Value: $397,000 - $444,000
4
Beds
2
Baths
971
Sq Ft
$432/Sq Ft
Est. Value
About This Home
This home is located at 467 W 100 N, Layton, UT 84041 and is currently estimated at $419,143, approximately $431 per square foot. 467 W 100 N is a home located in Davis County with nearby schools including Layton Elementary School, Fairfield Junior High School, and Layton High School.
Ownership History
Date
Name
Owned For
Owner Type
Purchase Details
Closed on
Aug 21, 2006
Sold by
Dover Patrick A and Dover Rhonda C
Bought by
Webb Thomas F and Webb Nancy E
Current Estimated Value
Purchase Details
Closed on
Nov 24, 1999
Sold by
Dover Patrick A and Dover Rhonda C
Bought by
Dover Patrick A and Dover Rhonda C
Create a Home Valuation Report for This Property
The Home Valuation Report is an in-depth analysis detailing your home's value as well as a comparison with similar homes in the area
Home Values in the Area
Average Home Value in this Area
Purchase History
| Date | Buyer | Sale Price | Title Company |
|---|---|---|---|
| Webb Thomas F | -- | Founders Title Co Layton | |
| Dover Patrick A | -- | -- |
Source: Public Records
Tax History Compared to Growth
Tax History
| Year | Tax Paid | Tax Assessment Tax Assessment Total Assessment is a certain percentage of the fair market value that is determined by local assessors to be the total taxable value of land and additions on the property. | Land | Improvement |
|---|---|---|---|---|
| 2025 | $2,038 | $213,950 | $107,584 | $106,366 |
| 2024 | $1,987 | $210,100 | $119,689 | $90,411 |
| 2023 | $1,840 | $343,000 | $117,073 | $225,927 |
| 2022 | $1,951 | $197,450 | $74,133 | $123,317 |
| 2021 | $1,822 | $275,000 | $111,232 | $163,768 |
| 2020 | $1,643 | $238,000 | $93,301 | $144,699 |
| 2019 | $1,600 | $227,000 | $96,582 | $130,418 |
| 2018 | $1,461 | $208,000 | $84,614 | $123,386 |
| 2016 | $1,115 | $81,895 | $32,811 | $49,084 |
| 2015 | $1,066 | $74,360 | $32,811 | $41,549 |
| 2014 | $1,035 | $73,805 | $32,811 | $40,994 |
| 2013 | -- | $71,883 | $17,588 | $54,295 |
Source: Public Records
Map
Nearby Homes