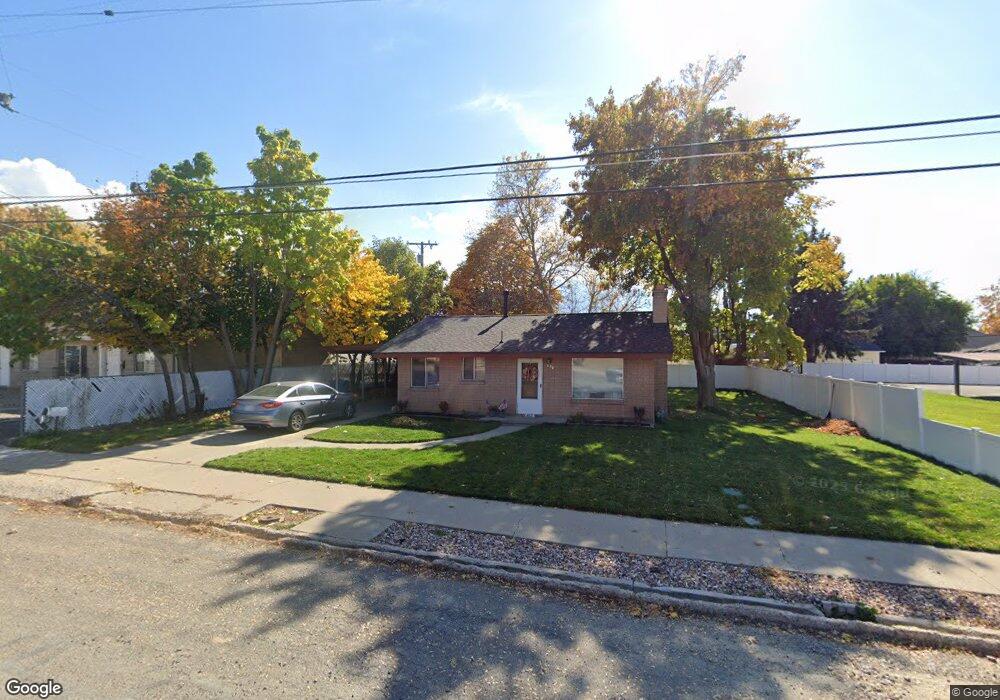
467 W 100 S Payson, UT 84651
Estimated Value: $355,408 - $363,000
2
Beds
1
Bath
896
Sq Ft
$402/Sq Ft
Est. Value
About This Home
This home is located at 467 W 100 S, Payson, UT 84651 and is currently estimated at $360,136, approximately $401 per square foot. 467 W 100 S is a home located in Utah County with nearby schools including Taylor Elementary School, Mt. Nebo Middle, and Payson Junior High School.
Ownership History
Date
Name
Owned For
Owner Type
Purchase Details
Closed on
Oct 27, 2022
Sold by
Provstgaard Robertj
Bought by
Frutos Michael and Frutos Amanda M
Current Estimated Value
Home Financials for this Owner
Home Financials are based on the most recent Mortgage that was taken out on this home.
Original Mortgage
$334,000
Outstanding Balance
$321,754
Interest Rate
6.02%
Mortgage Type
Seller Take Back
Estimated Equity
$38,382
Purchase Details
Closed on
Jun 7, 1999
Sold by
Barnett Darrell C and Barnett Clela F
Bought by
Provstgaard Robert J and Provstgaard Robin H
Home Financials for this Owner
Home Financials are based on the most recent Mortgage that was taken out on this home.
Original Mortgage
$63,500
Interest Rate
9.37%
Create a Home Valuation Report for This Property
The Home Valuation Report is an in-depth analysis detailing your home's value as well as a comparison with similar homes in the area
Home Values in the Area
Average Home Value in this Area
Purchase History
| Date | Buyer | Sale Price | Title Company |
|---|---|---|---|
| Frutos Michael | -- | -- | |
| Provstgaard Robert J | -- | Sundance Title Insurance Ag |
Source: Public Records
Mortgage History
| Date | Status | Borrower | Loan Amount |
|---|---|---|---|
| Open | Frutos Michael | $334,000 | |
| Previous Owner | Provstgaard Robert J | $63,500 |
Source: Public Records
Tax History
| Year | Tax Paid | Tax Assessment Tax Assessment Total Assessment is a certain percentage of the fair market value that is determined by local assessors to be the total taxable value of land and additions on the property. | Land | Improvement |
|---|---|---|---|---|
| 2025 | $1,592 | $162,470 | -- | -- |
| 2024 | $1,641 | $161,975 | $0 | $0 |
| 2023 | $1,641 | $167,420 | $0 | $0 |
| 2022 | $1,703 | $170,885 | $0 | $0 |
| 2021 | $1,425 | $229,400 | $89,000 | $140,400 |
| 2020 | $1,326 | $208,900 | $77,400 | $131,500 |
| 2019 | $1,129 | $182,300 | $66,800 | $115,500 |
| 2018 | $1,027 | $159,800 | $56,300 | $103,500 |
| 2017 | $948 | $79,310 | $0 | $0 |
| 2016 | $921 | $76,615 | $0 | $0 |
| 2015 | $904 | $74,635 | $0 | $0 |
| 2014 | $797 | $66,275 | $0 | $0 |
Source: Public Records
Map
Nearby Homes
- 323 W 100 S Unit 2
- 128 S 300 W
- 116 S 300 W
- 588 W Utah Ave
- 311 S 400 W
- 195 W 300 N
- 742 W 400 S
- 116 E 100 S
- 221 S Majestic Meadows Dr
- 225 S Majestic Meadows Dr
- 118 E 100 N
- 227 S Majestic Meadows Dr
- 533 S 700 W
- 1836 S 100 E
- 228 E Utah Ave
- 845 W 400 N
- 262 N 100 E
- 420 N 150 W
- 451 N 500 W
- 451 N 500 W Unit 39
Your Personal Tour Guide
Ask me questions while you tour the home.