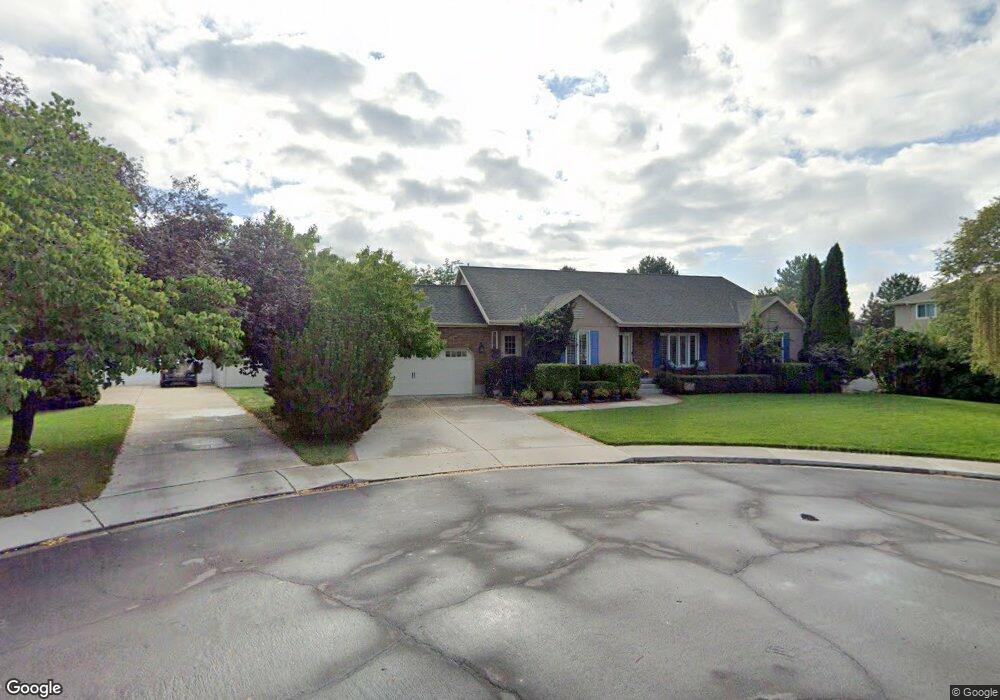
467 W 175 N Orem, UT 84057
Suncrest NeighborhoodEstimated Value: $656,000 - $739,000
2
Beds
4
Baths
2,593
Sq Ft
$265/Sq Ft
Est. Value
About This Home
This home is located at 467 W 175 N, Orem, UT 84057 and is currently estimated at $687,432, approximately $265 per square foot. 467 W 175 N is a home located in Utah County with nearby schools including Orem Junior High School, Mountain View High School, and Noah Webster Academy.
Ownership History
Date
Name
Owned For
Owner Type
Purchase Details
Closed on
May 31, 2019
Sold by
Dameron Ott H and Dameron Cynthia S
Bought by
Dameron Ott H and Dameron Ott H
Current Estimated Value
Home Financials for this Owner
Home Financials are based on the most recent Mortgage that was taken out on this home.
Original Mortgage
$34,000
Interest Rate
4.2%
Mortgage Type
Purchase Money Mortgage
Purchase Details
Closed on
Jul 17, 2007
Sold by
Dameron Ott H and Dameron Cynthia S
Bought by
Dameron Ott H and Dameron Cynthia S
Create a Home Valuation Report for This Property
The Home Valuation Report is an in-depth analysis detailing your home's value as well as a comparison with similar homes in the area
Home Values in the Area
Average Home Value in this Area
Purchase History
| Date | Buyer | Sale Price | Title Company |
|---|---|---|---|
| Dameron Ott H | -- | Vanguard Title Ins Agcy Llc | |
| Dameron Ott H | -- | Vanguard Title Ins Agcy Llc | |
| Dameron Ott H | -- | None Available |
Source: Public Records
Mortgage History
| Date | Status | Borrower | Loan Amount |
|---|---|---|---|
| Closed | Dameron Ott H | $34,000 |
Source: Public Records
Tax History
| Year | Tax Paid | Tax Assessment Tax Assessment Total Assessment is a certain percentage of the fair market value that is determined by local assessors to be the total taxable value of land and additions on the property. | Land | Improvement |
|---|---|---|---|---|
| 2025 | $2,790 | $374,605 | -- | -- |
| 2024 | $2,790 | $341,110 | $0 | $0 |
| 2023 | $2,606 | $342,485 | $0 | $0 |
| 2022 | $2,502 | $318,615 | $0 | $0 |
| 2021 | $2,413 | $465,300 | $123,800 | $341,500 |
| 2020 | $2,272 | $430,600 | $99,000 | $331,600 |
| 2019 | $2,185 | $430,600 | $99,000 | $331,600 |
| 2018 | $2,040 | $384,100 | $91,400 | $292,700 |
| 2017 | $1,845 | $186,120 | $0 | $0 |
| 2016 | $2,001 | $186,120 | $0 | $0 |
| 2015 | $1,984 | $174,515 | $0 | $0 |
| 2014 | $1,978 | $173,250 | $0 | $0 |
Source: Public Records
Map
Nearby Homes
- 162 N 450 W Unit 2
- 223 N 360 W
- 508 W 40 N
- 62 N 380 W
- 565 W 40 N
- 285 N 300 W
- 241 W Garden Park
- 208 W Garden Park
- 241 W 310 St N
- 64 S 320 W
- 62 N Garden Park Dr Unit 8
- 302 W 100 S
- 216 S 400 W
- 474 N Emery Ave
- 489 N Beverly Ave
- 369 N Main St Unit 2
- 33 W 400 N
- 597 N State St Unit 25
- 896 W 30 S
- 557 N Emery Ave
Your Personal Tour Guide
Ask me questions while you tour the home.