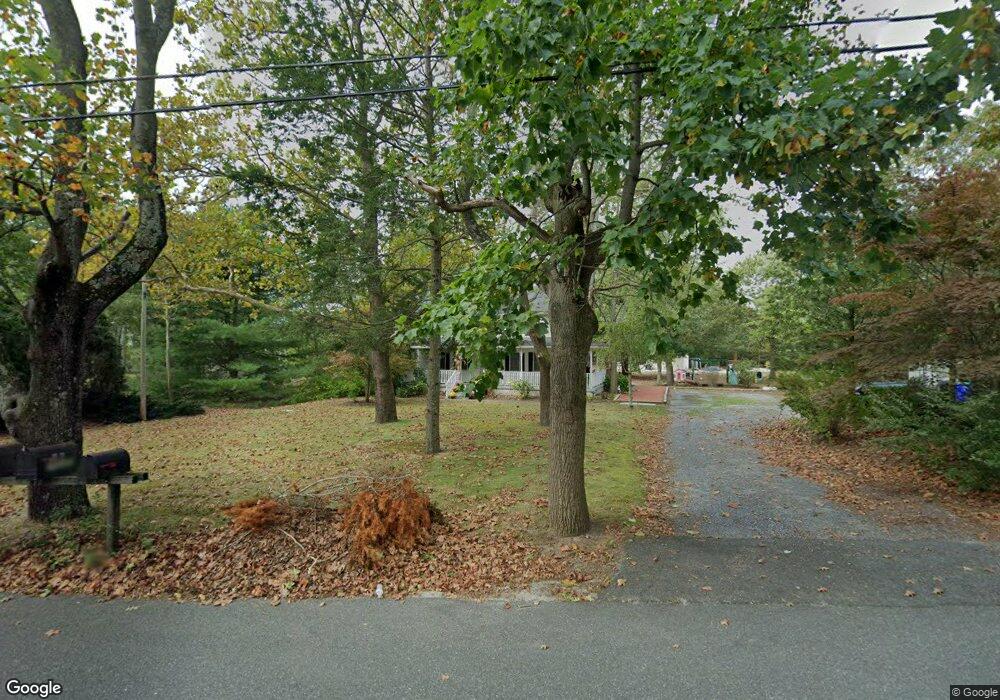
467 Walnut St Hammonton, NJ 08037
Estimated Value: $372,941 - $445,000
Studio
--
Bath
1,972
Sq Ft
$208/Sq Ft
Est. Value
About This Home
This home is located at 467 Walnut St, Hammonton, NJ 08037 and is currently estimated at $409,235, approximately $207 per square foot. 467 Walnut St is a home located in Atlantic County with nearby schools including Hammonton Early Childhood Education Center, Warren E. Sooy Jr. Elementary School, and Hammonton Middle School.
Ownership History
Date
Name
Owned For
Owner Type
Purchase Details
Closed on
Jul 31, 2019
Sold by
Newton Monica and Newton James
Bought by
Husta Tyler and Dejesse Stephanie
Current Estimated Value
Home Financials for this Owner
Home Financials are based on the most recent Mortgage that was taken out on this home.
Original Mortgage
$179,450
Outstanding Balance
$157,262
Interest Rate
3.73%
Mortgage Type
New Conventional
Estimated Equity
$251,973
Purchase Details
Closed on
Aug 23, 2018
Sold by
Kettinger Marla and Estate Of Michael F Perrone Jr
Bought by
Kettinger Marla and Dibona Michele
Purchase Details
Closed on
Oct 4, 2017
Sold by
Perrone Michael and Execuyot Of The Estate Perrone
Bought by
Perrone Michael
Purchase Details
Closed on
Jun 19, 2008
Sold by
Perrone Michael
Bought by
Perrone Marlene
Create a Home Valuation Report for This Property
The Home Valuation Report is an in-depth analysis detailing your home's value as well as a comparison with similar homes in the area
Home Values in the Area
Average Home Value in this Area
Purchase History
We collect this data history from publicly available records. To have your information removed, we recommend requesting removal directly through your county’s website.
| Date | Buyer | Sale Price | Title Company |
|---|---|---|---|
| Husta Tyler | $185,000 | Landis Title Corp | |
| Kettinger Marla | -- | None Available | |
| Perrone Michael | -- | None Available | |
| Perrone Marlene | -- | None Available |
Source: Public Records
Mortgage History
We collect this data history from publicly available records. To have your information removed, we recommend requesting removal directly through your county’s website.
| Date | Status | Borrower | Loan Amount |
|---|---|---|---|
| Open | Husta Tyler | $179,450 |
Source: Public Records
Tax History
| Year | Tax Paid | Tax Assessment Tax Assessment Total Assessment is a certain percentage of the fair market value that is determined by local assessors to be the total taxable value of land and additions on the property. | Land | Improvement |
|---|---|---|---|---|
| 2025 | $5,548 | $201,600 | $62,200 | $139,400 |
| 2024 | $5,548 | $201,600 | $62,200 | $139,400 |
| 2023 | $5,490 | $201,600 | $62,200 | $139,400 |
| 2022 | $5,490 | $201,600 | $62,200 | $139,400 |
| 2021 | $5,510 | $201,600 | $62,200 | $139,400 |
| 2020 | $5,482 | $201,600 | $62,200 | $139,400 |
| 2019 | $5,461 | $201,600 | $62,200 | $139,400 |
| 2018 | $5,435 | $201,600 | $62,200 | $139,400 |
| 2017 | $5,359 | $201,600 | $62,200 | $139,400 |
| 2016 | $5,163 | $201,600 | $62,200 | $139,400 |
| 2015 | $5,012 | $201,600 | $62,200 | $139,400 |
| 2014 | $4,432 | $119,500 | $31,300 | $88,200 |
Source: Public Records
Map
Nearby Homes
- 19 Anne Dr
- 366 North St
- 40 Toni Lynn Ct
- 19 Toni Lynn Ct
- 455 Old Forks Rd
- 401 Old Forks Rd
- 408 N Packard St
- 776 Fairview Ave
- 829 Wiltseys Mill Rd
- 309 N 4th St
- 828 N Chew Rd
- 113 N Packard St
- 34 N Packard St
- 228 Pleasant St E
- 26 N Packard St
- 131 N 2nd St
- 453 Bellevue Ave
- 448 N Chew Rd
- 439 N Chew Rd
- 550 Bellevue Ave
Your Personal Tour Guide
Ask me questions while you tour the home.