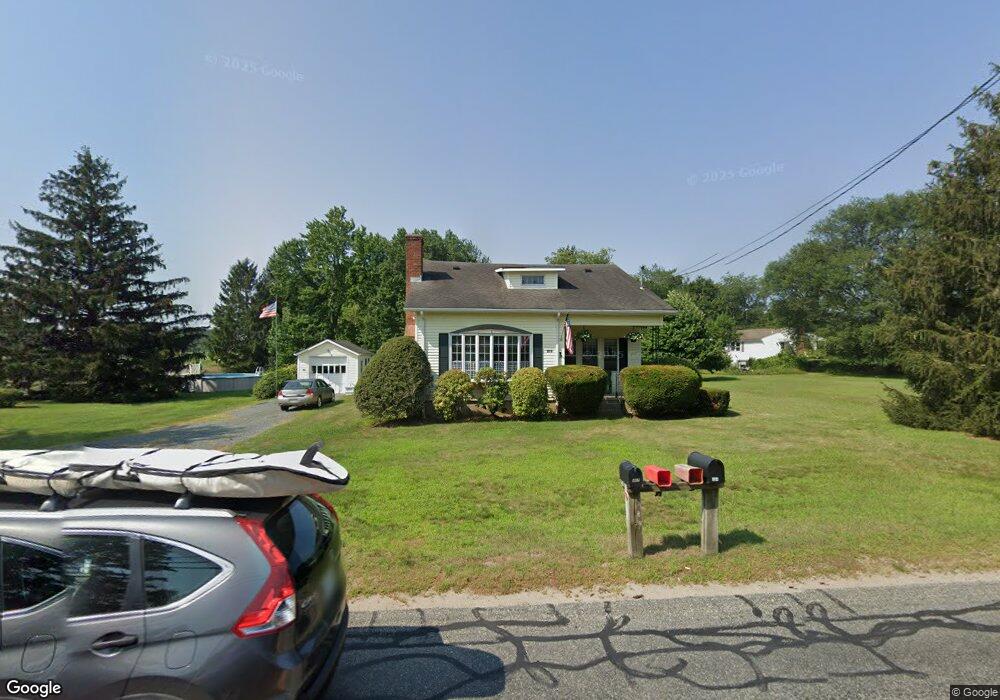
467 Warren Ave Swansea, MA 02777
Monroes-South Seekonk NeighborhoodEstimated Value: $476,000 - $570,000
3
Beds
1
Bath
1,809
Sq Ft
$282/Sq Ft
Est. Value
About This Home
This home is located at 467 Warren Ave, Swansea, MA 02777 and is currently estimated at $510,280, approximately $282 per square foot. 467 Warren Ave is a home located in Bristol County with nearby schools including Joseph Case High School, Barrington Christian Academy, and St. Andrews School.
Ownership History
Date
Name
Owned For
Owner Type
Purchase Details
Closed on
Jan 24, 2007
Sold by
Ingersoll Florence and Maccom Franklin S
Bought by
Sylvia Melanie M and Sylvia William G
Current Estimated Value
Purchase Details
Closed on
Mar 16, 2006
Sold by
Ingersoll Florence and Maccomb Franklin S
Bought by
Sylvia Melanie M and Sylvia William G
Home Financials for this Owner
Home Financials are based on the most recent Mortgage that was taken out on this home.
Original Mortgage
$302,567
Interest Rate
6.27%
Mortgage Type
Purchase Money Mortgage
Create a Home Valuation Report for This Property
The Home Valuation Report is an in-depth analysis detailing your home's value as well as a comparison with similar homes in the area
Home Values in the Area
Average Home Value in this Area
Purchase History
| Date | Buyer | Sale Price | Title Company |
|---|---|---|---|
| Sylvia Melanie M | $305,000 | -- | |
| Sylvia Melanie M | $305,000 | -- |
Source: Public Records
Mortgage History
| Date | Status | Borrower | Loan Amount |
|---|---|---|---|
| Previous Owner | Sylvia Melanie M | $302,567 |
Source: Public Records
Tax History Compared to Growth
Tax History
| Year | Tax Paid | Tax Assessment Tax Assessment Total Assessment is a certain percentage of the fair market value that is determined by local assessors to be the total taxable value of land and additions on the property. | Land | Improvement |
|---|---|---|---|---|
| 2025 | $4,863 | $408,000 | $180,000 | $228,000 |
| 2024 | $4,868 | $406,000 | $180,000 | $226,000 |
| 2023 | $4,590 | $349,600 | $132,400 | $217,200 |
| 2022 | $4,189 | $291,100 | $120,700 | $170,400 |
| 2021 | $2,083 | $269,000 | $120,700 | $148,300 |
| 2020 | $1,931 | $267,700 | $120,700 | $147,000 |
| 2019 | $4,029 | $259,800 | $108,100 | $151,700 |
| 2018 | $3,823 | $250,200 | $106,400 | $143,800 |
| 2017 | $3,365 | $253,400 | $106,400 | $147,000 |
| 2016 | $2,866 | $212,000 | $92,100 | $119,900 |
| 2015 | $2,763 | $210,400 | $92,100 | $118,300 |
| 2014 | $2,702 | $210,400 | $92,100 | $118,300 |
Source: Public Records
Map
Nearby Homes