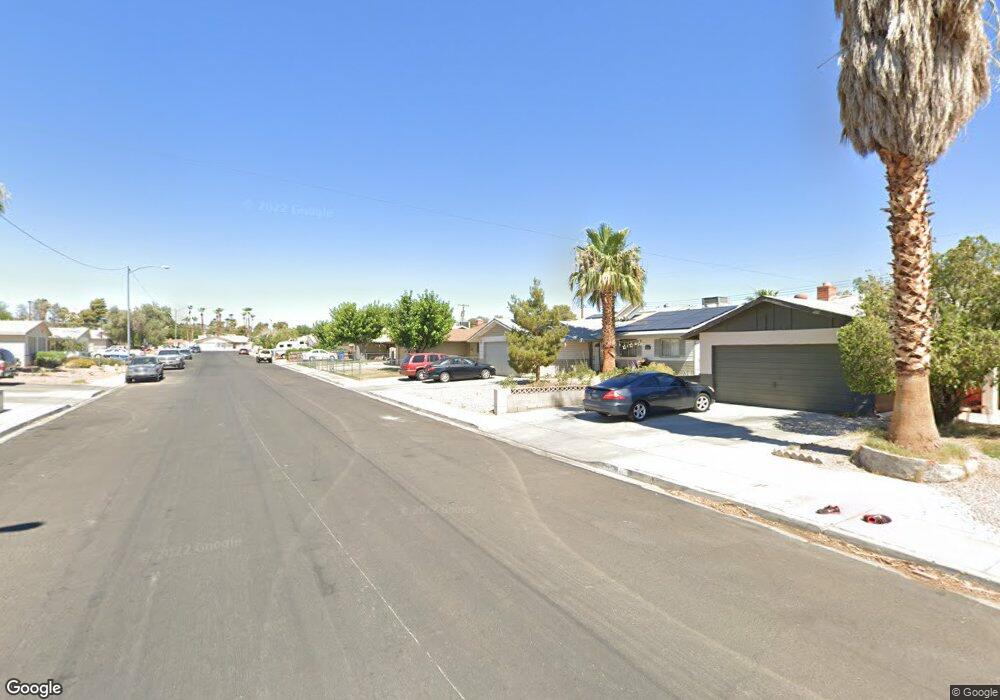
4670 Marnell Dr Las Vegas, NV 89121
Paradise Valley East NeighborhoodEstimated Value: $337,310 - $367,000
4
Beds
2
Baths
1,352
Sq Ft
$264/Sq Ft
Est. Value
About This Home
This home is located at 4670 Marnell Dr, Las Vegas, NV 89121 and is currently estimated at $356,578, approximately $263 per square foot. 4670 Marnell Dr is a home located in Clark County with nearby schools including J.M. Ullom Elementary School, C.W. Woodbury Middle School, and Chaparral High School.
Ownership History
Date
Name
Owned For
Owner Type
Purchase Details
Closed on
Mar 13, 2017
Sold by
Sibelrud Daniel B and Sibelrud Mureil
Bought by
Sibelrud Daniel Bertrun and Sibelrud Muriel Barbara
Current Estimated Value
Create a Home Valuation Report for This Property
The Home Valuation Report is an in-depth analysis detailing your home's value as well as a comparison with similar homes in the area
Home Values in the Area
Average Home Value in this Area
Purchase History
| Date | Buyer | Sale Price | Title Company |
|---|---|---|---|
| Sibelrud Daniel Bertrun | -- | None Available |
Source: Public Records
Tax History Compared to Growth
Tax History
| Year | Tax Paid | Tax Assessment Tax Assessment Total Assessment is a certain percentage of the fair market value that is determined by local assessors to be the total taxable value of land and additions on the property. | Land | Improvement |
|---|---|---|---|---|
| 2025 | $582 | $47,758 | $26,250 | $21,508 |
| 2024 | $582 | $47,758 | $26,250 | $21,508 |
| 2023 | $582 | $49,502 | $30,100 | $19,402 |
| 2022 | $474 | $43,594 | $26,250 | $17,344 |
| 2021 | $463 | $38,531 | $22,400 | $16,131 |
| 2020 | $529 | $33,173 | $17,500 | $15,673 |
| 2019 | $514 | $31,560 | $16,450 | $15,110 |
| 2018 | $499 | $29,637 | $15,400 | $14,237 |
| 2017 | $860 | $29,337 | $14,350 | $14,987 |
| 2016 | $474 | $26,570 | $10,500 | $16,070 |
| 2015 | $472 | $23,725 | $7,350 | $16,375 |
| 2014 | $458 | $21,627 | $6,300 | $15,327 |
Source: Public Records
Map
Nearby Homes
- 4754 Marnell Dr
- 4567 Dennis Way
- 4606 Powell Ave
- 4655 Bennett Dr
- 4564 Sampson Dr
- 4813 Plata Del Sol Dr
- 4625 La Fonda Dr
- 4727 Conrad St
- 4458 El Quinta Ct
- 4300 Don Quixote St
- 4845 S Mountain Vista St
- 4976 Billman Ave
- 4559 S Nellis Blvd
- 4567 S Nellis Blvd
- 4457 Rita Dr
- 4462 Newton Dr
- 4274 Gibraltar St
- 4785 San Sebastian Ave
- 4356 Powell Ave
- 4944 Rita Dr
- 4678 Marnell Dr
- 4662 Marnell Dr
- 4671 Gabriel Dr
- 4679 Gabriel Dr
- 4663 Gabriel Dr
- 4654 Marnell Dr
- 4680 Marnell Dr
- 4687 Gabriel Dr
- 4655 Gabriel Dr
- 4671 Marnell Dr
- 4663 Marnell Dr
- 4679 Marnell Dr
- 4696 Marnell Dr
- 4646 Marnell Dr
- 4655 Marnell Dr
- 4687 Marnell Dr
- 4647 Gabriel Dr
- 4695 Gabriel Dr
- 4647 Marnell Dr
- 4704 Marnell Dr