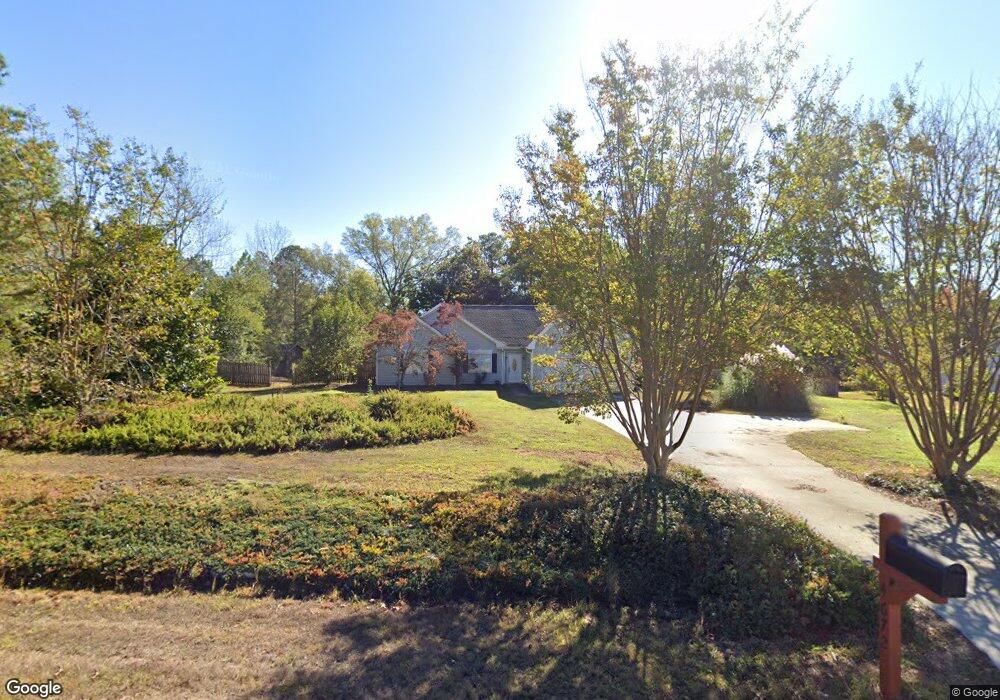
4672 Cedar Dr Loganville, GA 30052
Estimated Value: $356,000 - $385,000
--
Bed
--
Bath
2,102
Sq Ft
$178/Sq Ft
Est. Value
About This Home
This home is located at 4672 Cedar Dr, Loganville, GA 30052 and is currently estimated at $374,401, approximately $178 per square foot. 4672 Cedar Dr is a home located in Walton County with nearby schools including Sharon Elementary School, Loganville Middle School, and Loganville High School.
Ownership History
Date
Name
Owned For
Owner Type
Purchase Details
Closed on
Jun 25, 2003
Sold by
Hud
Bought by
Sosebee Kevin W and Sosebee Dena
Current Estimated Value
Home Financials for this Owner
Home Financials are based on the most recent Mortgage that was taken out on this home.
Original Mortgage
$93,200
Outstanding Balance
$39,714
Interest Rate
5.29%
Mortgage Type
New Conventional
Estimated Equity
$334,687
Purchase Details
Closed on
Jan 7, 2003
Sold by
Washington Mutual Fa
Bought by
Secretary Of Hud
Purchase Details
Closed on
Apr 14, 2000
Sold by
White Wallace Jjr and White Cynthia L
Bought by
Sollis Kevin and Sollis Shelia
Home Financials for this Owner
Home Financials are based on the most recent Mortgage that was taken out on this home.
Original Mortgage
$142,027
Interest Rate
8.23%
Mortgage Type
FHA
Purchase Details
Closed on
Oct 18, 1991
Bought by
White Wallace J
Create a Home Valuation Report for This Property
The Home Valuation Report is an in-depth analysis detailing your home's value as well as a comparison with similar homes in the area
Home Values in the Area
Average Home Value in this Area
Purchase History
| Date | Buyer | Sale Price | Title Company |
|---|---|---|---|
| Sosebee Kevin W | -- | -- | |
| Secretary Of Hud | -- | -- | |
| Wachovia Bk Na | $154,670 | -- | |
| Sollis Kevin | $142,100 | -- | |
| White Wallace J | $84,900 | -- |
Source: Public Records
Mortgage History
| Date | Status | Borrower | Loan Amount |
|---|---|---|---|
| Open | Sosebee Kevin W | $93,200 | |
| Closed | Sosebee Kevin W | $11,250 | |
| Previous Owner | Sollis Kevin | $142,027 |
Source: Public Records
Tax History Compared to Growth
Tax History
| Year | Tax Paid | Tax Assessment Tax Assessment Total Assessment is a certain percentage of the fair market value that is determined by local assessors to be the total taxable value of land and additions on the property. | Land | Improvement |
|---|---|---|---|---|
| 2024 | $2,973 | $126,368 | $22,000 | $104,368 |
| 2023 | $3,038 | $123,168 | $22,000 | $101,168 |
| 2022 | $2,952 | $109,448 | $18,800 | $90,648 |
| 2021 | $2,602 | $87,688 | $15,600 | $72,088 |
| 2020 | $2,643 | $86,528 | $15,600 | $70,928 |
| 2019 | $2,472 | $70,248 | $12,000 | $58,248 |
| 2018 | $2,286 | $70,248 | $12,000 | $58,248 |
| 2017 | $2,345 | $68,048 | $12,000 | $56,048 |
| 2016 | $2,089 | $60,060 | $12,000 | $48,060 |
| 2015 | $1,849 | $52,140 | $9,600 | $42,540 |
| 2014 | $1,571 | $42,992 | $0 | $0 |
Source: Public Records
Map
Nearby Homes
- 535 Penny Ln
- 1313 Golden Way
- 1318 Golden Way
- 969 Golden Meadows Ln
- 4827 Oakwood Ct
- 906 Callee Dr
- 2855 Milton Bryan Dr Unit 3
- Forrestall Plan at Cooper's Walk
- Malibu Plan at Cooper's Walk
- 904 Bessie Ct
- 240 Sandy Oak Dr
- 250 Sandy Oak Dr
- 40 Alameda St Unit 131
- 907 Bessie Ct
- Walker Plan at Cooper's Walk
- Westmoor Plan at Cooper's Walk
- Evergreen Plan at Cooper's Walk
- 1280 Windance Lake Dr
- Canterbury Plan at Cooper's Walk
- 0 Oak Ct Unit 7144047
- 0 Oak Ct Unit 7362215
- 0 Oak Ct Unit 7029566
- 0 Oak Ct
- 3045 Oak Ct
- 4682 Cedar Dr
- 3055 Oak Ct
- 3065 Oak Ct
- 4661 Cedar Dr
- 4671 Cedar Dr Unit 15
- 3075 Oak Ct
- 4692 Cedar Dr
- 4651 Cedar Dr
- 4681 Cedar Dr
- 3116 Oak Ct
- 3044 Oak Ct
- 0 Cedar Dr Unit 7340912
- 0 Cedar Dr Unit 8214823
- 0 Cedar Dr Unit 7359639
- 0 Cedar Dr Unit 8949986