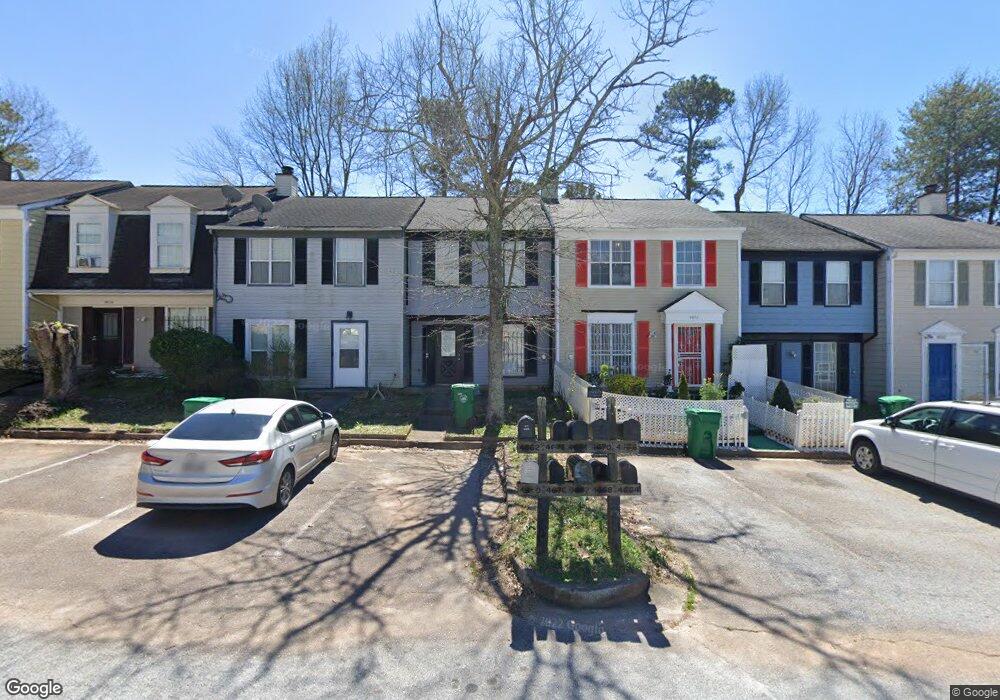
4672 Longman Way Unit 2 Stone Mountain, GA 30083
Estimated Value: $160,146 - $199,000
2
Beds
3
Baths
1,156
Sq Ft
$153/Sq Ft
Est. Value
About This Home
This home is located at 4672 Longman Way Unit 2, Stone Mountain, GA 30083 and is currently estimated at $177,037, approximately $153 per square foot. 4672 Longman Way Unit 2 is a home located in DeKalb County with nearby schools including Hambrick Elementary School, Stone Mountain Middle School, and Stone Mountain High School.
Ownership History
Date
Name
Owned For
Owner Type
Purchase Details
Closed on
Apr 18, 2017
Sold by
Mason Ian R
Bought by
Asfaha Tewodros B
Current Estimated Value
Purchase Details
Closed on
Jul 21, 2008
Sold by
Preston Steven C
Bought by
Mason Ian R
Purchase Details
Closed on
Jun 5, 2007
Sold by
Wells Fargo Bank Na
Bought by
Hud-Housing Of Urban Dev
Purchase Details
Closed on
Mar 25, 2002
Sold by
Franklin Riquiyah
Bought by
Bilalic Mustafa and Bilalic Dzevdana
Home Financials for this Owner
Home Financials are based on the most recent Mortgage that was taken out on this home.
Original Mortgage
$89,200
Interest Rate
6.85%
Mortgage Type
FHA
Purchase Details
Closed on
Dec 1, 2000
Sold by
Samadi Elvira S and David M
Bought by
Franklin Ruquiyah
Home Financials for this Owner
Home Financials are based on the most recent Mortgage that was taken out on this home.
Original Mortgage
$77,043
Interest Rate
7.71%
Mortgage Type
FHA
Create a Home Valuation Report for This Property
The Home Valuation Report is an in-depth analysis detailing your home's value as well as a comparison with similar homes in the area
Home Values in the Area
Average Home Value in this Area
Purchase History
| Date | Buyer | Sale Price | Title Company |
|---|---|---|---|
| Asfaha Tewodros B | $53,000 | -- | |
| Mason Ian R | -- | -- | |
| Hud-Housing Of Urban Dev | -- | -- | |
| Wells Fargo Bank Na | $91,227 | -- | |
| Bilalic Mustafa | $90,700 | -- | |
| Franklin Ruquiyah | $77,100 | -- |
Source: Public Records
Mortgage History
| Date | Status | Borrower | Loan Amount |
|---|---|---|---|
| Previous Owner | Bilalic Mustafa | $89,200 | |
| Previous Owner | Franklin Ruquiyah | $77,043 |
Source: Public Records
Tax History Compared to Growth
Tax History
| Year | Tax Paid | Tax Assessment Tax Assessment Total Assessment is a certain percentage of the fair market value that is determined by local assessors to be the total taxable value of land and additions on the property. | Land | Improvement |
|---|---|---|---|---|
| 2024 | $3,335 | $66,360 | $20,000 | $46,360 |
| 2023 | $3,335 | $69,280 | $20,000 | $49,280 |
| 2022 | $2,278 | $44,480 | $4,800 | $39,680 |
| 2021 | $1,862 | $35,000 | $4,800 | $30,200 |
| 2020 | $1,542 | $27,720 | $4,800 | $22,920 |
| 2019 | $1,495 | $26,640 | $4,800 | $21,840 |
| 2018 | $1,132 | $21,200 | $3,080 | $18,120 |
| 2017 | $1,207 | $20,000 | $3,160 | $16,840 |
| 2016 | $935 | $13,800 | $3,160 | $10,640 |
| 2014 | $784 | $10,120 | $3,160 | $6,960 |
Source: Public Records
Map
Nearby Homes
- 4685 Cedar Park Trail
- 4706 Cedar Park Trail
- 1462 Knights Trail
- 4842 Hairston Park Square
- 1251 Kelton Dr
- 4495 Mountain Ash Dr Unit 12
- 4475 Watson Ridge Dr
- 4450 Richmond Ct
- 4457 Watson Ridge Dr
- 4336 Morning View
- 1553 Spring Hollow Way
- 1406 Briers Dr Unit 3
- 1584 Jacobs Way
- 1169 Oaks Place
- 1432 Tilbury Place
- 1191 Demere Dr
- 1097 Old Saybrook Ct
- 4762 Old Highgate Entry
- 4670 Longman Way
- 4672 Longman Way
- 4668 Longman Way Unit 4668
- 4668 Longman Way
- 4668 Longman Way
- 4674 Longman Way
- 4666 Longman Way
- 4676 Longman Way
- 4676 Longman Way Unit 4676
- 4664 Longman Way
- 4678 Longman Way
- 4678 Longman Way Unit 4678
- 0 Longman Way Unit 7194959
- 0 Longman Way Unit 3260890
- 0 Longman Way
- 4680 Longman Way
- 4682 Longman Way
- 4682 Longman Way
- 1446 Inverness Dr
- 1418 Stonegate Point