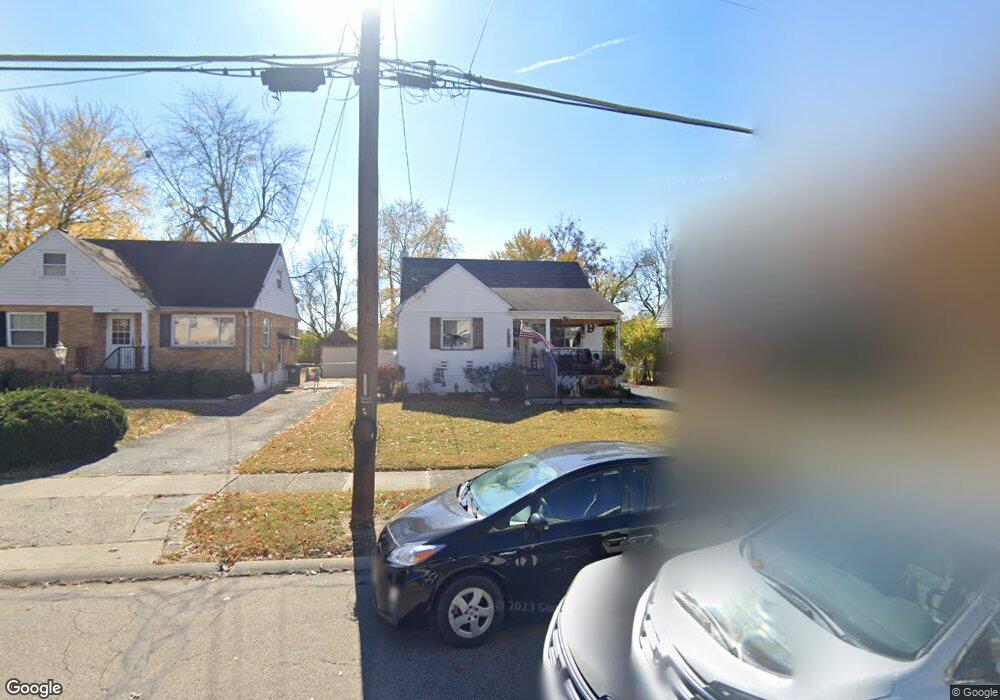
4673 Orchard Ln Cincinnati, OH 45236
Estimated Value: $281,000 - $328,000
3
Beds
1
Bath
1,295
Sq Ft
$242/Sq Ft
Est. Value
About This Home
This home is located at 4673 Orchard Ln, Cincinnati, OH 45236 and is currently estimated at $312,746, approximately $241 per square foot. 4673 Orchard Ln is a home located in Hamilton County with nearby schools including Indian Hill Primary School, Indian Hill Elementary School, and Indian Hill Middle School.
Ownership History
Date
Name
Owned For
Owner Type
Purchase Details
Closed on
Dec 12, 2014
Sold by
Green Alfreda and Harvey James
Bought by
The Board Of Township Trustees Of Sycamo
Current Estimated Value
Purchase Details
Closed on
May 16, 2006
Sold by
Heart Jonathan
Bought by
Green Alfreda
Home Financials for this Owner
Home Financials are based on the most recent Mortgage that was taken out on this home.
Original Mortgage
$122,000
Interest Rate
5.89%
Mortgage Type
Fannie Mae Freddie Mac
Purchase Details
Closed on
Jun 1, 2002
Sold by
Reif Arlie R
Bought by
Heart Jonathan
Home Financials for this Owner
Home Financials are based on the most recent Mortgage that was taken out on this home.
Original Mortgage
$102,000
Interest Rate
4.99%
Create a Home Valuation Report for This Property
The Home Valuation Report is an in-depth analysis detailing your home's value as well as a comparison with similar homes in the area
Home Values in the Area
Average Home Value in this Area
Purchase History
| Date | Buyer | Sale Price | Title Company |
|---|---|---|---|
| The Board Of Township Trustees Of Sycamo | -- | Attorney | |
| Green Alfreda | $152,500 | Accurate Title Solutions | |
| Heart Jonathan | $134,900 | Tri Star Title |
Source: Public Records
Mortgage History
| Date | Status | Borrower | Loan Amount |
|---|---|---|---|
| Previous Owner | Green Alfreda | $122,000 | |
| Previous Owner | Heart Jonathan | $102,000 |
Source: Public Records
Tax History
| Year | Tax Paid | Tax Assessment Tax Assessment Total Assessment is a certain percentage of the fair market value that is determined by local assessors to be the total taxable value of land and additions on the property. | Land | Improvement |
|---|---|---|---|---|
| 2025 | $3,688 | $89,069 | $35,403 | $53,666 |
| 2024 | $3,689 | $89,069 | $35,403 | $53,666 |
| 2023 | $3,641 | $89,069 | $35,403 | $53,666 |
| 2022 | $3,212 | $64,397 | $19,943 | $44,454 |
| 2021 | $3,031 | $64,397 | $19,943 | $44,454 |
| 2020 | $2,704 | $64,397 | $19,943 | $44,454 |
| 2019 | $2,545 | $56,487 | $17,493 | $38,994 |
| 2018 | $2,563 | $56,487 | $17,493 | $38,994 |
| 2017 | $2,438 | $56,487 | $17,493 | $38,994 |
| 2016 | $2,320 | $53,218 | $16,849 | $36,369 |
| 2015 | $2,335 | $53,218 | $16,849 | $36,369 |
| 2014 | $2,321 | $53,218 | $16,849 | $36,369 |
| 2013 | $2,358 | $52,175 | $16,520 | $35,655 |
Source: Public Records
Map
Nearby Homes
- 7722 Dalton Ave
- 6008 Winnetka Dr
- 34 Wentworth Ln
- 13 Wentworth Ln
- 42 Wentworth Ln
- 8021 Beech Ave
- 7800 Hosbrook Rd
- 4248 South Ave
- 4305 Myrtle Ave
- 7390 Hosbrook Rd
- 7300 N Mingo Ln
- 5635 Euclid Rd
- 6385 Kugler Mill Rd
- 4123 Hoffman Ave
- 8459 Vorhees Ln
- 5760 Kugler Mill Rd
- 4304 Kugler Mill Rd
- 4050 O'Leary Ave
- 4156 Linden Ave
- 7220 Mar Del Dr
- 4665 Orchard Ln
- 4681 Orchard Ln
- 4657 Orchard Ln
- 4689 Orchard Ln
- 4649 Orchard Ln
- 4697 Orchard Ln
- 4641 Orchard Ln
- 4705 Orchard Ln
- 4672 Orchard Ln
- 4664 Orchard Ln
- 4680 Orchard Ln
- 4633 Orchard Ln
- 4713 Orchard Ln
- 4656 Orchard Ln
- 4688 Orchard Ln
- 4648 Orchard Ln
- 4696 Orchard Ln
- 4625 Orchard Ln
- 4721 Orchard Ln
- 4640 Orchard Ln
Your Personal Tour Guide
Ask me questions while you tour the home.