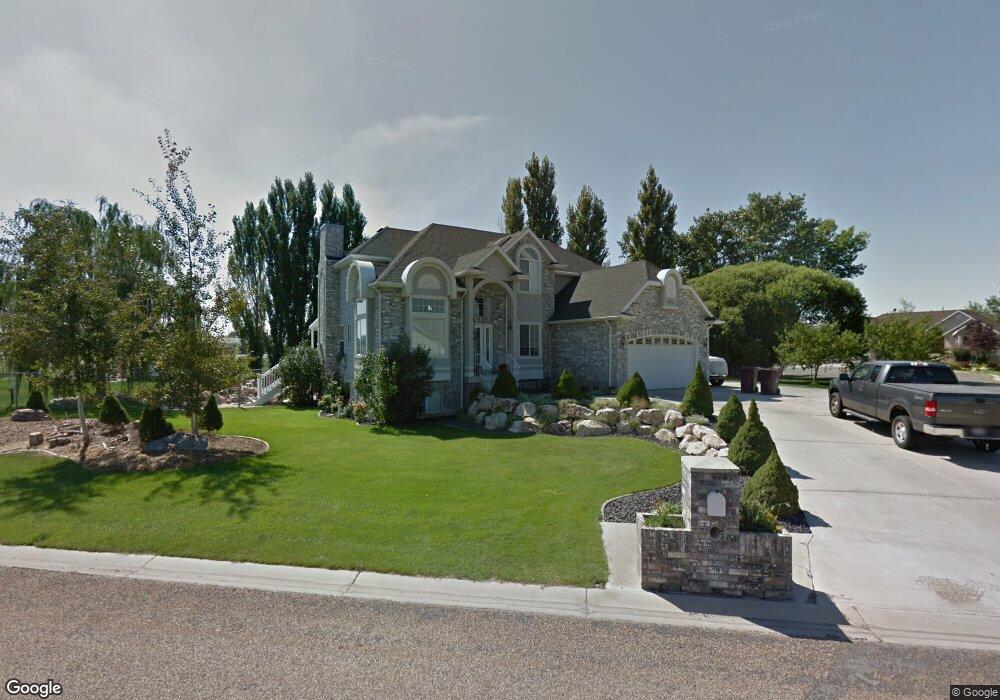
4673 S 4500 W West Haven, UT 84401
Estimated Value: $800,000 - $948,000
5
Beds
4
Baths
2,537
Sq Ft
$349/Sq Ft
Est. Value
About This Home
This home is located at 4673 S 4500 W, West Haven, UT 84401 and is currently estimated at $886,571, approximately $349 per square foot. 4673 S 4500 W is a home located in Weber County with nearby schools including Country View School, Rocky Mountain Junior High School, and Fremont High School.
Ownership History
Date
Name
Owned For
Owner Type
Purchase Details
Closed on
Apr 15, 2009
Sold by
Frearson Michael Allen and Marengo Rosemarie
Bought by
Frearson Michael Allen
Current Estimated Value
Home Financials for this Owner
Home Financials are based on the most recent Mortgage that was taken out on this home.
Original Mortgage
$253,000
Outstanding Balance
$161,902
Interest Rate
5.17%
Mortgage Type
Stand Alone Refi Refinance Of Original Loan
Estimated Equity
$724,669
Purchase Details
Closed on
Jan 10, 1997
Sold by
Kdr Llc
Bought by
Frearson Michael Allen
Create a Home Valuation Report for This Property
The Home Valuation Report is an in-depth analysis detailing your home's value as well as a comparison with similar homes in the area
Home Values in the Area
Average Home Value in this Area
Purchase History
| Date | Buyer | Sale Price | Title Company |
|---|---|---|---|
| Frearson Michael Allen | -- | Security Title Of Davis Cnty | |
| Frearson Michael Allen | -- | Cardon Land Title |
Source: Public Records
Mortgage History
| Date | Status | Borrower | Loan Amount |
|---|---|---|---|
| Open | Frearson Michael Allen | $253,000 |
Source: Public Records
Tax History Compared to Growth
Tax History
| Year | Tax Paid | Tax Assessment Tax Assessment Total Assessment is a certain percentage of the fair market value that is determined by local assessors to be the total taxable value of land and additions on the property. | Land | Improvement |
|---|---|---|---|---|
| 2025 | $5,622 | $871,774 | $225,009 | $646,765 |
| 2024 | $5,357 | $470,797 | $123,754 | $347,043 |
| 2023 | $5,567 | $495,550 | $123,755 | $371,795 |
| 2022 | $5,721 | $524,700 | $123,755 | $400,945 |
| 2021 | $3,841 | $566,000 | $109,802 | $456,198 |
| 2020 | $3,445 | $470,000 | $100,011 | $369,989 |
| 2019 | $3,524 | $461,000 | $80,099 | $380,901 |
| 2018 | $3,338 | $420,000 | $80,099 | $339,901 |
| 2017 | $3,128 | $383,000 | $75,074 | $307,926 |
| 2016 | $2,770 | $183,254 | $40,547 | $142,707 |
| 2015 | $2,675 | $176,458 | $40,547 | $135,911 |
| 2014 | $2,495 | $159,767 | $40,547 | $119,220 |
Source: Public Records
Map
Nearby Homes