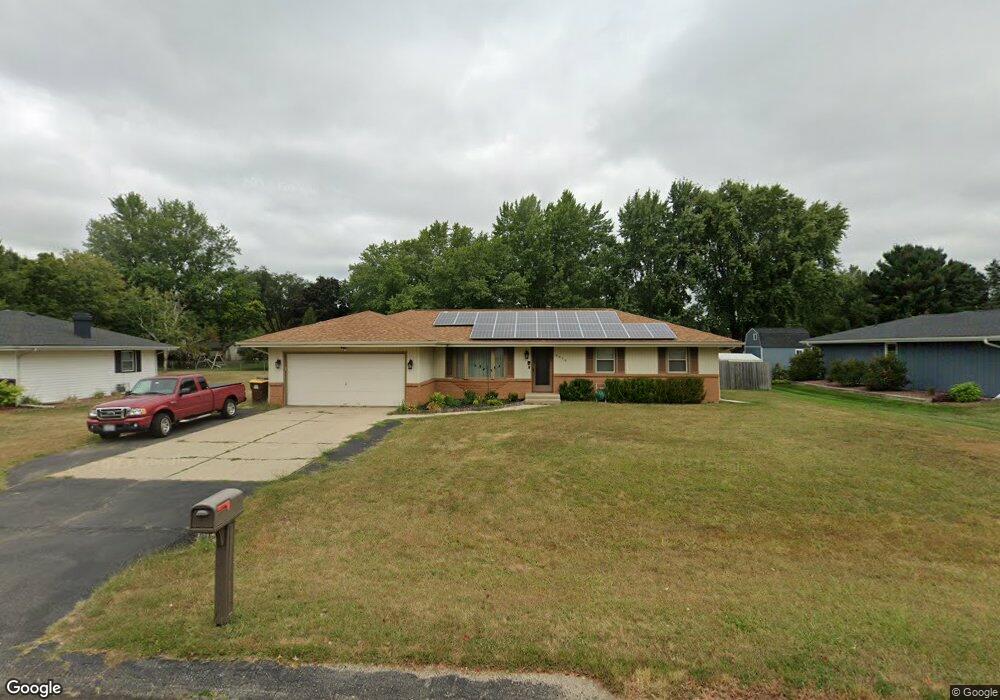
4674 Apollo Dr Machesney Park, IL 61115
Estimated Value: $215,000 - $238,000
3
Beds
2
Baths
1,332
Sq Ft
$170/Sq Ft
Est. Value
About This Home
This home is located at 4674 Apollo Dr, Machesney Park, IL 61115 and is currently estimated at $227,009, approximately $170 per square foot. 4674 Apollo Dr is a home located in Winnebago County with nearby schools including Marquette Elementary School, Harlem Middle School, and Harlem High School.
Ownership History
Date
Name
Owned For
Owner Type
Purchase Details
Closed on
Dec 31, 2017
Sold by
Mullins Daniel P and Mullins Suzanne E
Bought by
Mullins Daniel P
Current Estimated Value
Home Financials for this Owner
Home Financials are based on the most recent Mortgage that was taken out on this home.
Original Mortgage
$110,907
Outstanding Balance
$61,458
Interest Rate
3.5%
Mortgage Type
FHA
Estimated Equity
$165,551
Purchase Details
Closed on
Jul 14, 2000
Bought by
Mullins Daniel P and Mullins Suzanne E
Create a Home Valuation Report for This Property
The Home Valuation Report is an in-depth analysis detailing your home's value as well as a comparison with similar homes in the area
Home Values in the Area
Average Home Value in this Area
Purchase History
| Date | Buyer | Sale Price | Title Company |
|---|---|---|---|
| Mullins Daniel P | -- | None Listed On Document | |
| Mullins Daniel P | $114,000 | -- |
Source: Public Records
Mortgage History
| Date | Status | Borrower | Loan Amount |
|---|---|---|---|
| Open | Mullins Daniel P | $110,907 |
Source: Public Records
Tax History Compared to Growth
Tax History
| Year | Tax Paid | Tax Assessment Tax Assessment Total Assessment is a certain percentage of the fair market value that is determined by local assessors to be the total taxable value of land and additions on the property. | Land | Improvement |
|---|---|---|---|---|
| 2024 | $3,889 | $60,632 | $6,950 | $53,682 |
| 2023 | $3,637 | $53,847 | $6,172 | $47,675 |
| 2022 | $3,985 | $49,112 | $5,629 | $43,483 |
| 2021 | $3,674 | $45,677 | $5,235 | $40,442 |
| 2020 | $3,363 | $43,511 | $4,987 | $38,524 |
| 2019 | $3,456 | $41,677 | $4,777 | $36,900 |
| 2018 | $3,611 | $40,310 | $4,620 | $35,690 |
| 2017 | $3,622 | $39,204 | $4,493 | $34,711 |
| 2016 | $3,561 | $38,424 | $4,404 | $34,020 |
| 2015 | $3,531 | $37,752 | $4,327 | $33,425 |
| 2014 | $3,473 | $37,752 | $4,327 | $33,425 |
Source: Public Records
Map
Nearby Homes