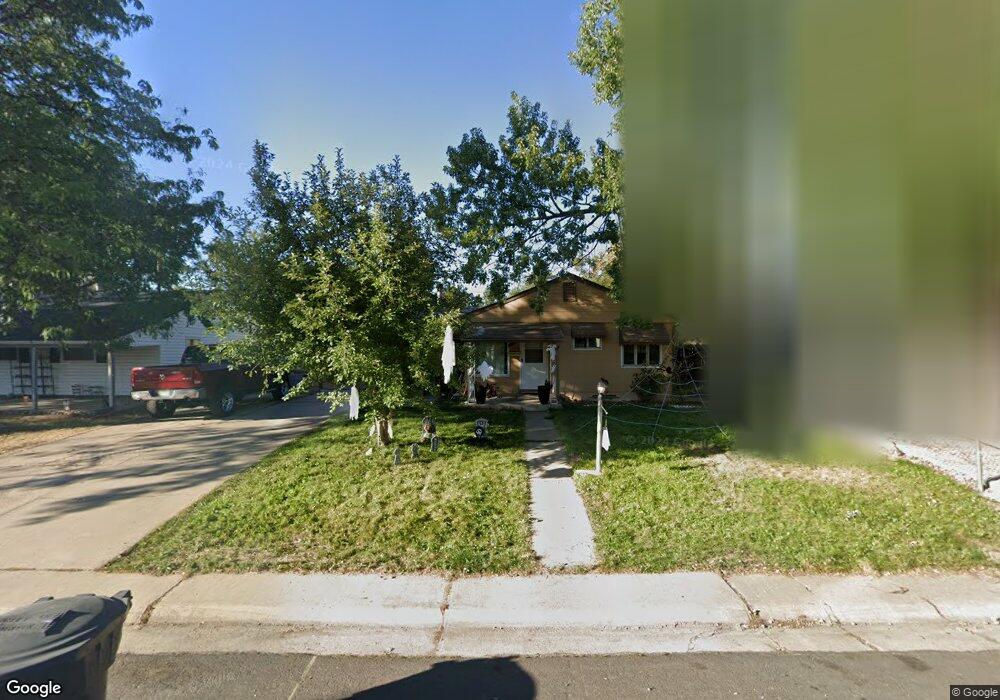
4675 E Bails Place Denver, CO 80222
Virginia Village NeighborhoodEstimated Value: $513,000 - $575,000
2
Beds
2
Baths
889
Sq Ft
$616/Sq Ft
Est. Value
About This Home
This home is located at 4675 E Bails Place, Denver, CO 80222 and is currently estimated at $547,607, approximately $615 per square foot. 4675 E Bails Place is a home located in Denver County with nearby schools including Ellis Elementary School, Merrill Middle School, and South High School.
Ownership History
Date
Name
Owned For
Owner Type
Purchase Details
Closed on
Aug 17, 2001
Sold by
Beran Gregory S and Beran Patricia S
Bought by
Flores Jose and Silban Heidi A
Current Estimated Value
Home Financials for this Owner
Home Financials are based on the most recent Mortgage that was taken out on this home.
Original Mortgage
$195,242
Outstanding Balance
$72,724
Interest Rate
7.16%
Mortgage Type
FHA
Estimated Equity
$474,883
Purchase Details
Closed on
Sep 4, 1996
Sold by
Greg Skufca
Bought by
Beran Gregory S and Beran Patricia S
Purchase Details
Closed on
Nov 30, 1995
Sold by
Miller Shirley L
Bought by
Skufca Greg
Home Financials for this Owner
Home Financials are based on the most recent Mortgage that was taken out on this home.
Original Mortgage
$116,350
Interest Rate
7.4%
Mortgage Type
FHA
Purchase Details
Closed on
Sep 21, 1995
Sold by
Miller Shirley L and Jayne Williametta G
Bought by
Miller Shirley L
Create a Home Valuation Report for This Property
The Home Valuation Report is an in-depth analysis detailing your home's value as well as a comparison with similar homes in the area
Home Values in the Area
Average Home Value in this Area
Purchase History
| Date | Buyer | Sale Price | Title Company |
|---|---|---|---|
| Flores Jose | $198,000 | -- | |
| Beran Gregory S | $119,900 | -- | |
| Skufca Greg | $95,000 | -- | |
| Miller Shirley L | -- | -- |
Source: Public Records
Mortgage History
| Date | Status | Borrower | Loan Amount |
|---|---|---|---|
| Open | Flores Jose | $195,242 | |
| Previous Owner | Skufca Greg | $116,350 |
Source: Public Records
Tax History
| Year | Tax Paid | Tax Assessment Tax Assessment Total Assessment is a certain percentage of the fair market value that is determined by local assessors to be the total taxable value of land and additions on the property. | Land | Improvement |
|---|---|---|---|---|
| 2025 | $2,946 | $39,620 | $17,220 | $17,220 |
| 2024 | $2,946 | $37,190 | $12,680 | $24,510 |
| 2023 | $2,882 | $37,190 | $12,680 | $24,510 |
| 2022 | $2,468 | $31,030 | $10,610 | $20,420 |
| 2021 | $2,383 | $31,930 | $10,920 | $21,010 |
| 2020 | $2,052 | $27,660 | $8,740 | $18,920 |
| 2019 | $1,995 | $27,660 | $8,740 | $18,920 |
| 2018 | $1,977 | $25,550 | $8,350 | $17,200 |
| 2017 | $1,971 | $25,550 | $8,350 | $17,200 |
| 2016 | $1,902 | $23,330 | $5,835 | $17,495 |
| 2015 | $1,823 | $23,330 | $5,835 | $17,495 |
| 2014 | $1,382 | $16,640 | $5,835 | $10,805 |
Source: Public Records
Map
Nearby Homes
- 4701 E Jewell Ave
- 1860 S Dahlia St
- 4645 E Colorado Ave
- 1971 S Dahlia St
- 1843 S Elm St
- 4901 E Asbury Ave
- 4600 E Asbury Cir Unit 104
- 4600 E Asbury Cir Unit 110
- 4600 E Asbury Cir Unit 411
- 1708 S Eudora St
- 1732 S Elm St
- 1827 S Filbert Ct
- 1693 S Elm St
- 5175 E Mexico Ave
- 1711 S Forest St
- 5180 E Asbury Ave
- 1603 S Elm St
- 1585 S Elm St
- 2180 S Birch St
- 1695 S Ginger Ct
- 4699 E Bails Place
- 4651 E Bails Place
- 4701 E Bails Place
- 4652 E Utah Place
- 4676 E Utah Place
- 4626 E Utah Place
- 4625 E Bails Place
- 4674 E Bails Place
- 4698 E Bails Place
- 4700 E Utah Place
- 4650 E Bails Place
- 4600 E Utah Place
- 4700 E Bails Place
- 4583 E Bails Place
- 4624 E Bails Place
- 4726 E Utah Place
- 4582 E Utah Place
- 4753 E Bails Place
- 4750 E Bails Place
- 4582 E Bails Place
Your Personal Tour Guide
Ask me questions while you tour the home.