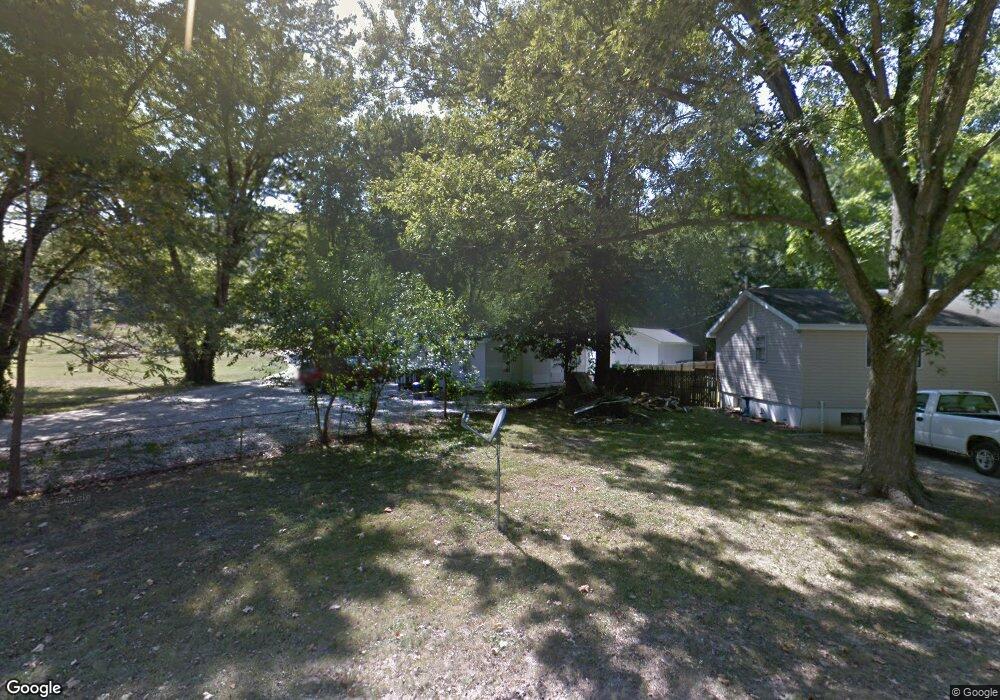
4675 Spring Glen Dr House Springs, MO 63051
Estimated Value: $156,000 - $204,000
--
Bed
--
Bath
842
Sq Ft
$207/Sq Ft
Est. Value
About This Home
This home is located at 4675 Spring Glen Dr, House Springs, MO 63051 and is currently estimated at $173,928, approximately $206 per square foot. 4675 Spring Glen Dr is a home with nearby schools including Northwest High School and St. Anthony School.
Ownership History
Date
Name
Owned For
Owner Type
Purchase Details
Closed on
Nov 3, 2021
Sold by
Penovich William J and Penovich Ashley
Bought by
Derousse Zachary J
Current Estimated Value
Home Financials for this Owner
Home Financials are based on the most recent Mortgage that was taken out on this home.
Original Mortgage
$113,131
Outstanding Balance
$103,506
Interest Rate
2.88%
Mortgage Type
New Conventional
Estimated Equity
$70,422
Purchase Details
Closed on
Oct 11, 2002
Sold by
Kostedt Jerry R and Yowell Emily M
Bought by
Penovich William J
Home Financials for this Owner
Home Financials are based on the most recent Mortgage that was taken out on this home.
Original Mortgage
$78,380
Interest Rate
6.2%
Mortgage Type
FHA
Purchase Details
Closed on
Sep 21, 2001
Sold by
Vicich Barbara A and Trust Of Gerald D Vicich
Bought by
Kostedt Jerry R and Yowell Emily M
Home Financials for this Owner
Home Financials are based on the most recent Mortgage that was taken out on this home.
Original Mortgage
$78,650
Interest Rate
6.88%
Mortgage Type
FHA
Create a Home Valuation Report for This Property
The Home Valuation Report is an in-depth analysis detailing your home's value as well as a comparison with similar homes in the area
Home Values in the Area
Average Home Value in this Area
Purchase History
| Date | Buyer | Sale Price | Title Company |
|---|---|---|---|
| Derousse Zachary J | -- | Continental Title Company | |
| Penovich William J | -- | Commonwealth Title | |
| Kostedt Jerry R | -- | First American Title |
Source: Public Records
Mortgage History
| Date | Status | Borrower | Loan Amount |
|---|---|---|---|
| Open | Derousse Zachary J | $113,131 | |
| Previous Owner | Penovich William J | $78,380 | |
| Previous Owner | Kostedt Jerry R | $78,650 |
Source: Public Records
Tax History Compared to Growth
Tax History
| Year | Tax Paid | Tax Assessment Tax Assessment Total Assessment is a certain percentage of the fair market value that is determined by local assessors to be the total taxable value of land and additions on the property. | Land | Improvement |
|---|---|---|---|---|
| 2025 | $813 | $12,000 | $3,300 | $8,700 |
| 2024 | $813 | $11,300 | $3,300 | $8,000 |
| 2023 | $813 | $11,300 | $3,300 | $8,000 |
| 2022 | $809 | $11,300 | $3,300 | $8,000 |
| 2021 | $0 | $11,300 | $3,300 | $8,000 |
| 2020 | $744 | $10,200 | $3,000 | $7,200 |
| 2019 | $744 | $10,200 | $3,000 | $7,200 |
| 2018 | $752 | $10,200 | $3,000 | $7,200 |
| 2017 | $686 | $10,200 | $3,000 | $7,200 |
| 2016 | $627 | $9,300 | $3,000 | $6,300 |
| 2015 | $631 | $9,300 | $3,000 | $6,300 |
| 2013 | -- | $8,900 | $2,800 | $6,100 |
Source: Public Records
Map
Nearby Homes
- 0 Wedgewood Dr
- 4636 Gravois Rd
- 4595 Indian Springs Rd
- 4811 Wedgewood Dr
- 00 Gravois Rd
- 4591 Highway W
- 0000 Oakcrest Dr
- 6043 Parkedge Dr
- 4386 Cottage Grove Rd
- 6026 Grandview Rd
- 0 Trails End Trail Tract 2
- 0 Trails End Trail Tract 1
- 0 Kley Ln Unit MAR24062328
- 0 Lots 10 & 11 Hillcrest Dr Unit 21025129
- 6770 Kley Ln
- 5975 Ridge Dr
- 5025 Hill Dr
- 4670 Trails End Trail
- 0 Fernwood Dr
- 0 Yates Ave Unit MAR25017971
- 4671 Spring Glen Dr
- 4667 Spring Glen Dr
- 4680 Spring Glen Dr
- 100 Patient Way
- 4672 Spring Glen Dr
- 4668 Spring Glen Dr
- 4659 Spring Glen Dr
- 4656 Spring Glen Dr
- 4750 Hillsboro House Spgs Rd
- 4650 Spring Glen Dr
- 4685 Big 3 Acres
- 4675 Big 3 Acres
- 4681 Hillsboro House Spgs Rd
- 4851 Hillsboro House Springs Rd
- 4851 Hillsboro House Springs Rd
- 4671 Hillsboro House Spgs Rd
- 4690 Hillsboro House Springs Rd
- 4690 Hillsboro House Spgs Rd
- 4690 Hillsboro-House Springs Rd