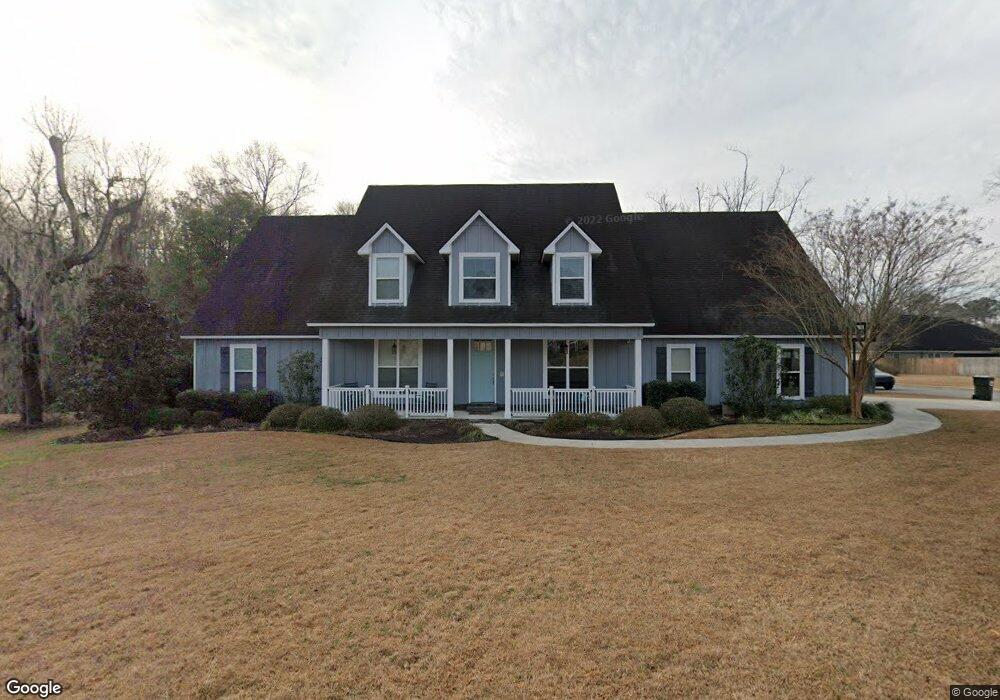
4676 San Saba Dr Hahira, GA 31632
Estimated Value: $467,000 - $483,000
5
Beds
3
Baths
2,852
Sq Ft
$167/Sq Ft
Est. Value
About This Home
This home is located at 4676 San Saba Dr, Hahira, GA 31632 and is currently estimated at $476,151, approximately $166 per square foot. 4676 San Saba Dr is a home located in Lowndes County with nearby schools including Westside Elementary School, Hahira Middle School, and Lowndes High School.
Ownership History
Date
Name
Owned For
Owner Type
Purchase Details
Closed on
Aug 22, 2023
Sold by
Parker Zachary R
Bought by
Bacon Jordan Lee and Hutchins Mary Allison
Current Estimated Value
Home Financials for this Owner
Home Financials are based on the most recent Mortgage that was taken out on this home.
Original Mortgage
$395,250
Outstanding Balance
$359,451
Interest Rate
6.11%
Mortgage Type
New Conventional
Estimated Equity
$116,700
Purchase Details
Closed on
Aug 10, 2010
Sold by
Colony Bank Quitman Fsb
Bought by
Parker Zachary R and Parker Emily S
Home Financials for this Owner
Home Financials are based on the most recent Mortgage that was taken out on this home.
Original Mortgage
$260,500
Interest Rate
4.61%
Mortgage Type
Purchase Money Mortgage
Purchase Details
Closed on
Mar 11, 2008
Sold by
Ainsley Properties
Bought by
Colony Bank
Purchase Details
Closed on
Dec 21, 2007
Sold by
Grove Pointe
Bought by
Ainsley Properties
Purchase Details
Closed on
Feb 28, 2006
Sold by
Dasher Howard Comp Inc
Bought by
Grove Pointe Llc
Create a Home Valuation Report for This Property
The Home Valuation Report is an in-depth analysis detailing your home's value as well as a comparison with similar homes in the area
Home Values in the Area
Average Home Value in this Area
Purchase History
| Date | Buyer | Sale Price | Title Company |
|---|---|---|---|
| Bacon Jordan Lee | $465,000 | -- | |
| Parker Zachary R | $39,000 | -- | |
| Colony Bank | -- | -- | |
| Ainsley Properties | -- | -- | |
| Grove Pointe Llc | $7,094,300 | -- |
Source: Public Records
Mortgage History
| Date | Status | Borrower | Loan Amount |
|---|---|---|---|
| Open | Bacon Jordan Lee | $395,250 | |
| Previous Owner | Parker Zachary R | $260,500 |
Source: Public Records
Tax History Compared to Growth
Tax History
| Year | Tax Paid | Tax Assessment Tax Assessment Total Assessment is a certain percentage of the fair market value that is determined by local assessors to be the total taxable value of land and additions on the property. | Land | Improvement |
|---|---|---|---|---|
| 2024 | $3,984 | $164,436 | $24,000 | $140,436 |
| 2023 | $3,984 | $160,436 | $20,000 | $140,436 |
| 2022 | $3,920 | $144,408 | $20,000 | $124,408 |
| 2021 | $3,540 | $125,464 | $20,000 | $105,464 |
| 2020 | $3,292 | $125,464 | $20,000 | $105,464 |
| 2019 | $3,168 | $119,705 | $19,200 | $100,505 |
| 2018 | $3,200 | $119,705 | $19,200 | $100,505 |
| 2017 | $3,244 | $119,705 | $19,200 | $100,505 |
| 2016 | $3,253 | $119,705 | $19,200 | $100,505 |
| 2015 | $3,118 | $119,705 | $19,200 | $100,505 |
| 2014 | $3,182 | $119,705 | $19,200 | $100,505 |
Source: Public Records
Map
Nearby Homes
- 5263 Maycomb Ave
- 5372 Myrick Cir
- 4773 Pawnee Dr
- 0 Dasher Grove Rd
- 5379 Maycomb Ave
- 5229 Maycomb Ave
- 5047 Planters Crossing
- 5020 Hatfield Cir
- 5078 Planters Crossing
- 4735 Layla Ln
- 5039 Hatfield Cir
- 4609 Amelia Cir
- 4809 Brown Cat Cir
- 3041 Houser Way
- 5051 Hatfield Cir
- 5055 Hatfield Cir
- 3061 Houser Way
- 4868 Brown Cat Cir
- 4860 Brown Cat Cir
- 5211 Abbott Cir
- 4473 Mahan Dr
- 4668 San Saba Dr
- 4675 San Saba Dr
- 4451 Mahan Dr
- 4476 Kiowa Ln
- 4686 San Saba Dr
- 4681 San Saba Dr
- 4667 San Saba Dr
- 4660 San Saba Dr
- 4687 San Saba Dr
- 4480 Kiowa Ln
- 4661 San Saba Dr
- 4457 Mahan Dr
- 4692 San Saba Dr
- 4475 Kiowa Ln
- 4484 Kiowa Ln
- 4693 San Saba Dr
- 4655 San Saba Dr
- 4654 San Saba Dr
- 4463 Mahan Dr