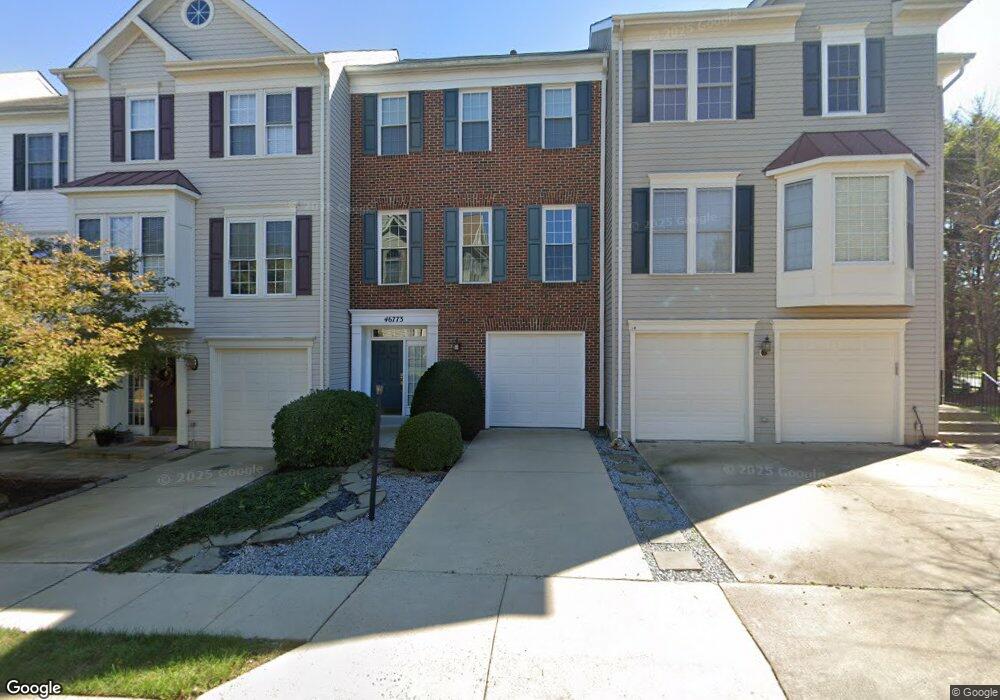
46773 Keswick Square Sterling, VA 20165
Estimated Value: $642,394 - $663,000
3
Beds
3
Baths
2,196
Sq Ft
$297/Sq Ft
Est. Value
About This Home
This home is located at 46773 Keswick Square, Sterling, VA 20165 and is currently estimated at $651,599, approximately $296 per square foot. 46773 Keswick Square is a home located in Loudoun County with nearby schools including Horizon Elementary School, River Bend Middle School, and Potomac Falls High School.
Ownership History
Date
Name
Owned For
Owner Type
Purchase Details
Closed on
Jun 21, 2001
Sold by
Feinglass David A
Bought by
Karayan Vahe
Current Estimated Value
Home Financials for this Owner
Home Financials are based on the most recent Mortgage that was taken out on this home.
Original Mortgage
$184,416
Outstanding Balance
$69,991
Interest Rate
7.09%
Estimated Equity
$581,608
Purchase Details
Closed on
Apr 23, 1997
Sold by
Bartek Glenn M
Bought by
Feinglass David A
Home Financials for this Owner
Home Financials are based on the most recent Mortgage that was taken out on this home.
Original Mortgage
$158,589
Interest Rate
7.77%
Mortgage Type
FHA
Purchase Details
Closed on
Mar 29, 1996
Sold by
Vanwagoner John F
Bought by
Bartek Glenn M
Home Financials for this Owner
Home Financials are based on the most recent Mortgage that was taken out on this home.
Original Mortgage
$159,600
Interest Rate
6.9%
Purchase Details
Closed on
Mar 28, 1995
Sold by
Coscan Washington Inc
Bought by
Vanwagoner John F
Home Financials for this Owner
Home Financials are based on the most recent Mortgage that was taken out on this home.
Original Mortgage
$170,800
Interest Rate
8.78%
Mortgage Type
Purchase Money Mortgage
Create a Home Valuation Report for This Property
The Home Valuation Report is an in-depth analysis detailing your home's value as well as a comparison with similar homes in the area
Home Values in the Area
Average Home Value in this Area
Purchase History
| Date | Buyer | Sale Price | Title Company |
|---|---|---|---|
| Karayan Vahe | $230,520 | -- | |
| Feinglass David A | $161,000 | -- | |
| Bartek Glenn M | $168,000 | -- | |
| Vanwagoner John F | $179,840 | -- |
Source: Public Records
Mortgage History
| Date | Status | Borrower | Loan Amount |
|---|---|---|---|
| Open | Karayan Vahe | $184,416 | |
| Previous Owner | Vanwagoner John F | $158,589 | |
| Previous Owner | Vanwagoner John F | $159,600 | |
| Previous Owner | Vanwagoner John F | $170,800 |
Source: Public Records
Tax History Compared to Growth
Tax History
| Year | Tax Paid | Tax Assessment Tax Assessment Total Assessment is a certain percentage of the fair market value that is determined by local assessors to be the total taxable value of land and additions on the property. | Land | Improvement |
|---|---|---|---|---|
| 2025 | $4,827 | $599,630 | $190,000 | $409,630 |
| 2024 | $4,970 | $574,610 | $175,000 | $399,610 |
| 2023 | $4,768 | $544,870 | $175,000 | $369,870 |
| 2022 | $4,606 | $517,580 | $150,000 | $367,580 |
| 2021 | $4,467 | $455,840 | $130,000 | $325,840 |
| 2020 | $4,479 | $432,780 | $125,000 | $307,780 |
| 2019 | $4,327 | $414,030 | $125,000 | $289,030 |
| 2018 | $4,308 | $397,030 | $125,000 | $272,030 |
| 2017 | $4,306 | $382,740 | $125,000 | $257,740 |
| 2016 | $4,304 | $375,930 | $0 | $0 |
| 2015 | $4,361 | $259,250 | $0 | $259,250 |
| 2014 | $4,408 | $256,620 | $0 | $256,620 |
Source: Public Records
Map
Nearby Homes
- 20597 Glenmere Square
- 46809 Trailwood Place
- 46675 Cavendish Square
- 20687 Smithfield Ct
- 46606 Drysdale Terrace Unit 101
- 110 Sugarland Run Dr
- 203 Greenfield Ct
- 105 Woodgate Ct
- 126 Hillsdale Dr
- 86 Sugarland Run Dr
- 229 W Meadowland Ln
- 23 Monarch Dr
- 26 Carousel Ct
- 25 Jefferson Dr
- 100 Marcum Ct
- 500 Giles Place
- 502 Giles Place
- 47277 Ox Bow Cir
- 20627 Cutwater Place
- 46699 Paragon Terrace
- 46775 Keswick Square
- 46771 Keswick Square
- 46777 Keswick Square
- 46779 Keswick Square
- 46781 Keswick Square
- 20544 Burgess Terrace
- 20542 Burgess Terrace
- 46785 Keswick Square
- 20540 Burgess Terrace
- 46787 Keswick Square
- 20538 Burgess Terrace
- 46789 Keswick Square
- 20536 Burgess Terrace
- 46802 Keswick Square
- 46791 Keswick Square
- 46804 Keswick Square
- 46760 Oakmere Terrace
- 20534 Burgess Terrace
- 46790 Lawnes Creek Terrace