Estimated Value: $501,000 - $538,479
3
Beds
1
Bath
1,624
Sq Ft
$317/Sq Ft
Est. Value
About This Home
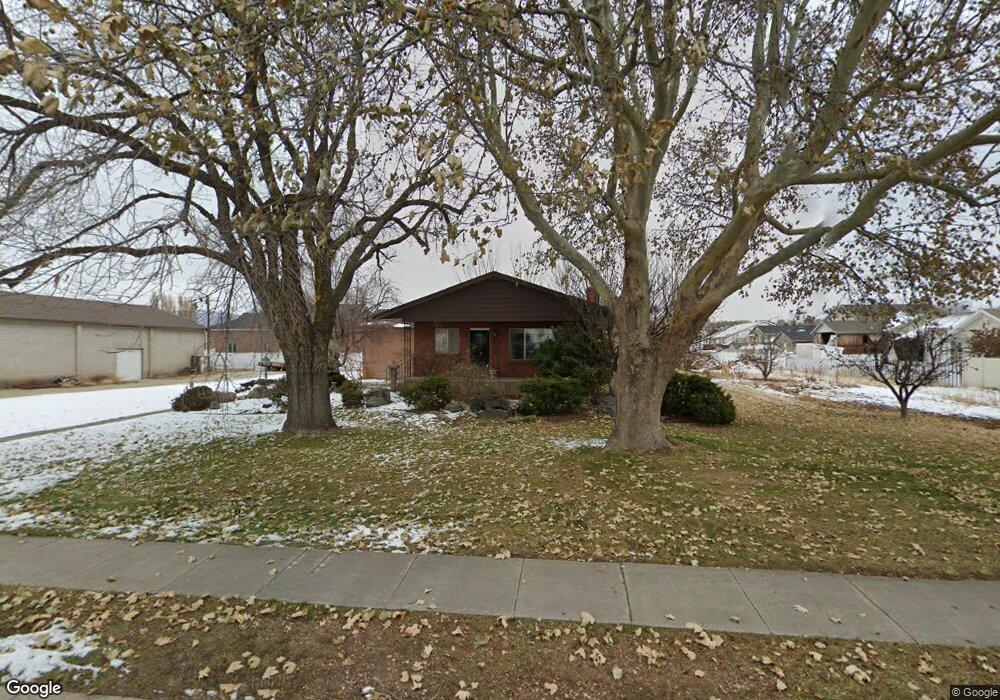
This home is located at 4678 S 3100 W, Roy, UT 84067 and is currently estimated at $514,870, approximately $317 per square foot. 4678 S 3100 W is a home located in Weber County with nearby schools including Midland School, Sand Ridge Junior High School, and Roy High School.
Ownership History
Date
Name
Owned For
Owner Type
Purchase Details
Closed on
Apr 7, 2021
Sold by
Miya Masami and Miya Kyoko Kawasaki
Bought by
Miya Masami and Miya Kyoko Kawasaki
Current Estimated Value
Purchase Details
Closed on
Nov 4, 2008
Sold by
Miyagishima Masami and Miyagishima Kyoko
Bought by
Miya Masami and Miya Kyoko Kawasaki
Purchase Details
Closed on
Jul 14, 2004
Sold by
Kay Rocky John and Kay Jared A
Bought by
Miyagishima Masami and Miyagishima Kyoko
Purchase Details
Closed on
Jun 10, 2004
Sold by
Kay Rockie John and Kay Jared A
Bought by
Rockhard Construction Llc and Kay Rockie J
Purchase Details
Closed on
Mar 19, 2004
Sold by
Miyagishima Masami and Miyagishima Kyoko
Bought by
Miyagishima Masami and Miyagishima Kyoko
Purchase Details
Closed on
Mar 12, 2004
Sold by
Miyagishima Masami and Miyagishima Kyoko
Bought by
Miyagishima Masami and Miyagishima Kyoko
Purchase Details
Closed on
Apr 17, 2000
Sold by
Sandoval Luis O
Bought by
Miyagishima Masami and Miyagishima Kyoko
Create a Home Valuation Report for This Property
The Home Valuation Report is an in-depth analysis detailing your home's value as well as a comparison with similar homes in the area
Home Values in the Area
Average Home Value in this Area
Purchase History
| Date | Buyer | Sale Price | Title Company |
|---|---|---|---|
| Miya Masami | -- | None Available | |
| Miya Masami | -- | None Available | |
| Miyagishima Masami | -- | First American Title | |
| Rockhard Construction Llc | -- | First American Title | |
| Miyagishima Masami | -- | -- | |
| Miyagishima Masami | -- | -- | |
| Miyagishima Masami | -- | Mountain View Title |
Source: Public Records
Tax History Compared to Growth
Tax History
| Year | Tax Paid | Tax Assessment Tax Assessment Total Assessment is a certain percentage of the fair market value that is determined by local assessors to be the total taxable value of land and additions on the property. | Land | Improvement |
|---|---|---|---|---|
| 2025 | $3,465 | $534,147 | $200,012 | $334,135 |
| 2024 | $3,390 | $291,973 | $112,684 | $179,289 |
| 2023 | $3,011 | $256,179 | $97,827 | $158,352 |
| 2022 | $3,298 | $288,750 | $80,903 | $207,847 |
| 2021 | $2,959 | $429,000 | $112,425 | $316,575 |
| 2020 | $2,747 | $365,001 | $112,425 | $252,576 |
| 2019 | $2,700 | $340,000 | $73,522 | $266,478 |
| 2018 | $2,744 | $330,001 | $67,800 | $262,201 |
| 2017 | $2,361 | $264,001 | $67,800 | $196,201 |
| 2016 | $2,114 | $127,546 | $37,200 | $90,346 |
| 2015 | $2,015 | $125,384 | $37,200 | $88,184 |
| 2014 | $2,025 | $125,384 | $37,200 | $88,184 |
Source: Public Records
Map
Nearby Homes
- 4635 S 2950 W
- 3014 W 4750 S
- 3046 W 4850 S
- 4510 Stone Creek Rd Unit F
- 3084 W 4375 S
- 4440 Stone Creek Rd Unit 2E
- 4491 Haven Creek Rd Unit A
- 4891 S 2875 W
- 2979 W 4275 S
- 4918 S 2925 W
- 3434 W 4525 S
- 2816 W 4400 S
- 4317 S 3350 W
- 2802 W 4375 S
- 5009 S 2925 W
- 5003 S 2825 W
- 4964 S 3375 W
- 2835 W 4200 S
- 4875 S 2675 W
- 5063 S 2825 W