4679 Spring Ridge Dr Flowery Branch, GA 30542
Estimated Value: $300,000 - $342,223
3
Beds
2
Baths
1,423
Sq Ft
$227/Sq Ft
Est. Value
About This Home
This home is located at 4679 Spring Ridge Dr, Flowery Branch, GA 30542 and is currently estimated at $322,556, approximately $226 per square foot. 4679 Spring Ridge Dr is a home located in Hall County with nearby schools including Martin Elementary School, Southwest Middle School, and C.W. Davis Middle School.
Ownership History
Date
Name
Owned For
Owner Type
Purchase Details
Closed on
Dec 14, 2011
Sold by
Hudacko Michael
Bought by
Scranton Jared Reid and Scranton Sarah Jane
Current Estimated Value
Home Financials for this Owner
Home Financials are based on the most recent Mortgage that was taken out on this home.
Original Mortgage
$85,500
Outstanding Balance
$58,628
Interest Rate
4.06%
Mortgage Type
New Conventional
Estimated Equity
$263,928
Purchase Details
Closed on
May 4, 2006
Sold by
Harbin Thomas K and Harbin Tina L
Bought by
Hudacko Michael
Home Financials for this Owner
Home Financials are based on the most recent Mortgage that was taken out on this home.
Original Mortgage
$127,000
Interest Rate
6.41%
Mortgage Type
New Conventional
Purchase Details
Closed on
Aug 3, 1998
Sold by
Blackwell Joe H and Blackwell Janine C
Bought by
Harbin Thomas K and Harbin Tina L
Home Financials for this Owner
Home Financials are based on the most recent Mortgage that was taken out on this home.
Original Mortgage
$113,700
Interest Rate
6.96%
Mortgage Type
VA
Create a Home Valuation Report for This Property
The Home Valuation Report is an in-depth analysis detailing your home's value as well as a comparison with similar homes in the area
Home Values in the Area
Average Home Value in this Area
Purchase History
| Date | Buyer | Sale Price | Title Company |
|---|---|---|---|
| Scranton Jared Reid | $90,000 | -- | |
| Hudacko Michael | $149,900 | -- | |
| Harbin Thomas K | $111,500 | -- |
Source: Public Records
Mortgage History
| Date | Status | Borrower | Loan Amount |
|---|---|---|---|
| Open | Scranton Jared Reid | $85,500 | |
| Previous Owner | Hudacko Michael | $127,000 | |
| Previous Owner | Harbin Thomas K | $113,700 |
Source: Public Records
Tax History Compared to Growth
Tax History
| Year | Tax Paid | Tax Assessment Tax Assessment Total Assessment is a certain percentage of the fair market value that is determined by local assessors to be the total taxable value of land and additions on the property. | Land | Improvement |
|---|---|---|---|---|
| 2024 | $2,961 | $114,840 | $25,320 | $89,520 |
| 2023 | $2,844 | $109,920 | $25,320 | $84,600 |
| 2022 | $2,427 | $89,320 | $17,720 | $71,600 |
| 2021 | $2,071 | $74,040 | $16,440 | $57,600 |
| 2020 | $1,909 | $66,080 | $12,960 | $53,120 |
| 2019 | $1,780 | $60,760 | $11,400 | $49,360 |
| 2018 | $1,645 | $54,000 | $11,400 | $42,600 |
| 2017 | $1,498 | $49,360 | $11,400 | $37,960 |
| 2016 | $1,224 | $40,520 | $11,400 | $29,120 |
| 2015 | $1,062 | $34,338 | $5,240 | $29,098 |
| 2014 | $1,062 | $34,338 | $5,240 | $29,098 |
Source: Public Records
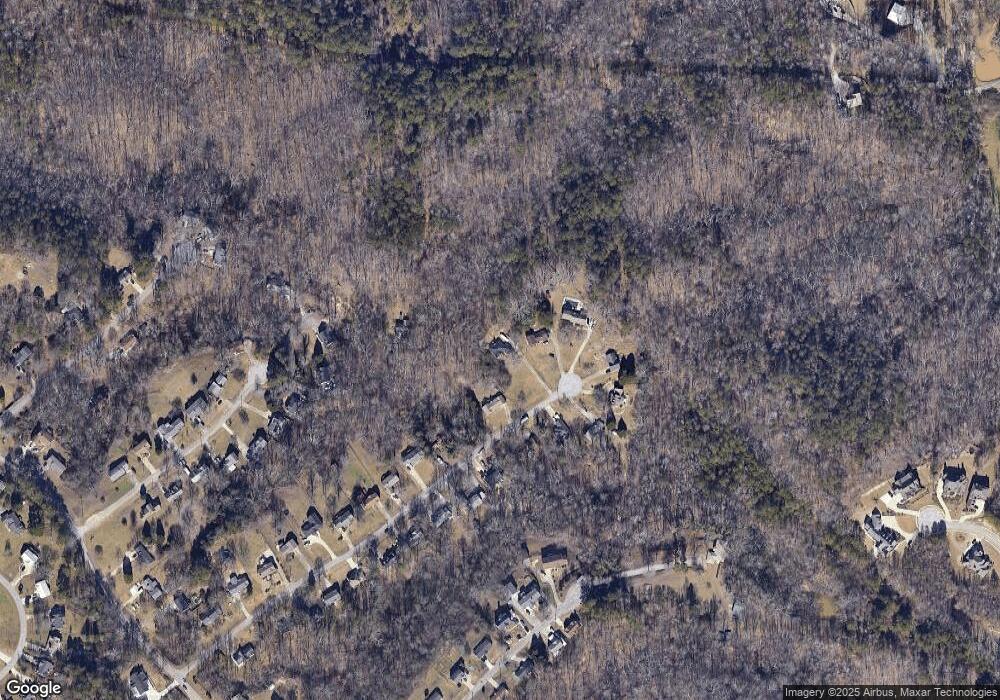
Map
Nearby Homes
- 4647 Laurel Brook Dr
- 4864 Grandview Ct
- 4860 Grandview Ct
- 4947 Cash Rd
- 4695 Eucalyptus Way
- 4826 Rose Heights Dr
- 7344 Rocklin Ln
- 5619 Chickory Dr Unit 126
- 5651 Chickory Dr Unit 118
- 4827 Daintree Ct
- 4674 Quail Pointe Dr
- 5059 Lancashire Ct
- 5021 Limerick Ln
- 0 Hog Mountain Rd Unit 9051064
- 6151 Spout Springs Rd
- 4580 J M Turk Rd
- 4711 Grandview Pkwy
- 4685 Spring Ridge Dr
- 4673 Spring Ridge Dr
- 4689 Spring Ridge Dr
- 4661 Spring Ridge Dr
- 4667 Spring Ridge Dr
- 4678 Spring Ridge Dr
- 4672 Spring Ridge Dr
- 4684 Spring Ridge Dr
- 4688 Spring Ridge Dr
- 4664 Spring Ridge Dr
- 4664 Spring Ridge
- 4655 Spring Ridge Dr
- 4655 Spring Ridge Dr Unit 42
- 4658 Spring Ridge Dr
- 4649 Spring Ridge Dr
- 4646 Laurel Brook Dr
- 4652 Laurel Brook Dr
- 4650 Spring Ridge Dr
- 4644 Spring Ridge Dr
- 4642 Laurel Brook Dr