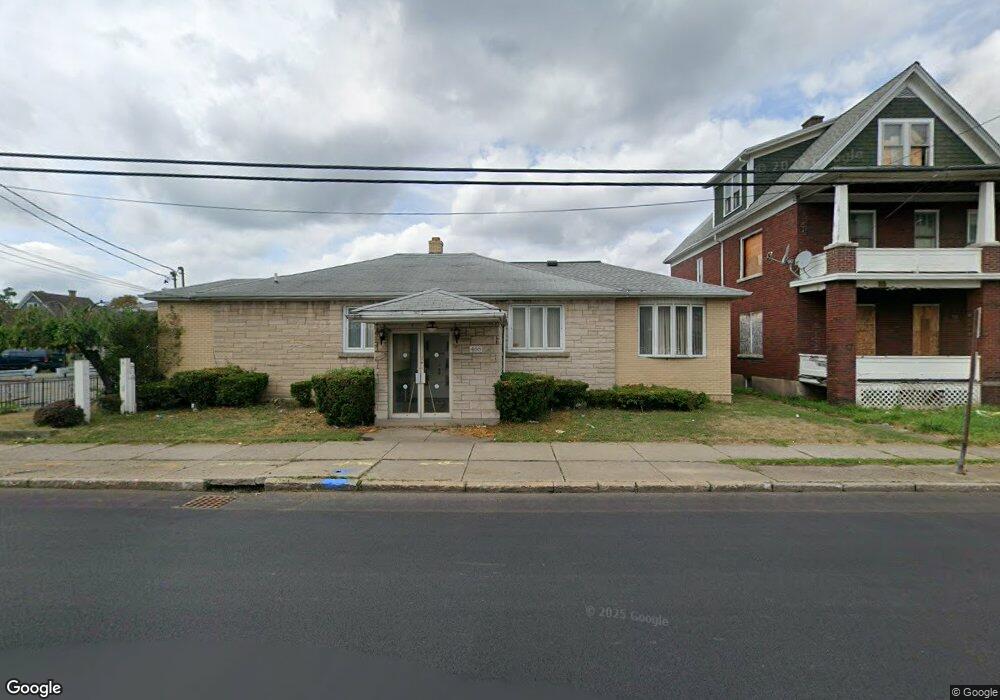
468 19th St Niagara Falls, NY 14303
South End NeighborhoodEstimated Value: $352,854
--
Bed
--
Bath
6,838
Sq Ft
$52/Sq Ft
Est. Value
About This Home
This home is located at 468 19th St, Niagara Falls, NY 14303 and is currently estimated at $352,854, approximately $51 per square foot. 468 19th St is a home located in Niagara County with nearby schools including Niagara Falls High School.
Ownership History
Date
Name
Owned For
Owner Type
Purchase Details
Closed on
Nov 7, 2014
Sold by
Colucci John C
Bought by
Servants Of Jesus And Mary Inc
Current Estimated Value
Home Financials for this Owner
Home Financials are based on the most recent Mortgage that was taken out on this home.
Original Mortgage
$112,500
Outstanding Balance
$86,747
Interest Rate
4.18%
Mortgage Type
Commercial
Estimated Equity
$266,107
Purchase Details
Closed on
Oct 10, 2000
Sold by
Colucci Mario J
Bought by
Colucci John C
Create a Home Valuation Report for This Property
The Home Valuation Report is an in-depth analysis detailing your home's value as well as a comparison with similar homes in the area
Home Values in the Area
Average Home Value in this Area
Purchase History
| Date | Buyer | Sale Price | Title Company |
|---|---|---|---|
| Servants Of Jesus And Mary Inc | $150,000 | None Available | |
| Colucci John C | -- | Angelo Massaro |
Source: Public Records
Mortgage History
| Date | Status | Borrower | Loan Amount |
|---|---|---|---|
| Open | Servants Of Jesus And Mary Inc | $112,500 |
Source: Public Records
Tax History Compared to Growth
Tax History
| Year | Tax Paid | Tax Assessment Tax Assessment Total Assessment is a certain percentage of the fair market value that is determined by local assessors to be the total taxable value of land and additions on the property. | Land | Improvement |
|---|---|---|---|---|
| 2024 | $5,822 | $100,000 | $3,100 | $96,900 |
| 2023 | $9,539 | $100,000 | $3,100 | $96,900 |
| 2022 | -- | $195,000 | $3,100 | $191,900 |
| 2021 | -- | $195,000 | $3,100 | $191,900 |
| 2020 | -- | $195,000 | $3,100 | $191,900 |
| 2019 | -- | $195,000 | $3,100 | $191,900 |
| 2018 | -- | $195,000 | $3,100 | $191,900 |
| 2017 | -- | $195,000 | $3,100 | $191,900 |
| 2016 | $0 | $195,000 | $3,100 | $191,900 |
| 2015 | -- | $195,000 | $3,100 | $191,900 |
| 2014 | -- | $195,000 | $3,100 | $191,900 |
Source: Public Records
Map
Nearby Homes