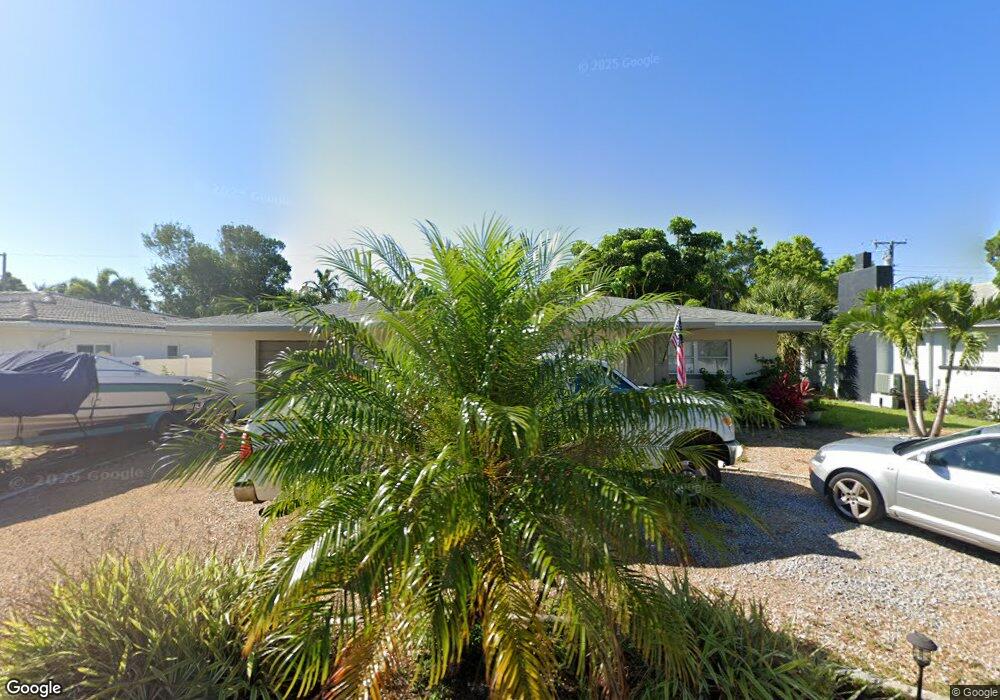
468 81st Ave Unit 4 Saint Pete Beach, FL 33706
Estimated Value: $382,000 - $519,000
2
Beds
2
Baths
952
Sq Ft
$458/Sq Ft
Est. Value
About This Home
This home is located at 468 81st Ave Unit 4, Saint Pete Beach, FL 33706 and is currently estimated at $435,852, approximately $457 per square foot. 468 81st Ave Unit 4 is a home located in Pinellas County with nearby schools including Azalea Elementary School, Azalea Middle School, and Boca Ciega High School.
Ownership History
Date
Name
Owned For
Owner Type
Purchase Details
Closed on
Jul 29, 2016
Sold by
Howes Chris M and Howes Sharon L
Bought by
Puma Mary Lou Li and Puma Jerald P Li
Current Estimated Value
Home Financials for this Owner
Home Financials are based on the most recent Mortgage that was taken out on this home.
Original Mortgage
$192,000
Outstanding Balance
$153,588
Interest Rate
3.56%
Mortgage Type
New Conventional
Estimated Equity
$282,264
Purchase Details
Closed on
Mar 21, 2012
Sold by
Howes Chris M and Howes Sharon L
Bought by
Howes Chris M and Howes Sharon L
Purchase Details
Closed on
Oct 26, 2011
Sold by
Milliken James R
Bought by
Howe Chris M and Howes Sharon L
Purchase Details
Closed on
Mar 24, 2006
Sold by
Milliken James R and Milliken Robert A
Bought by
Milliken James R
Create a Home Valuation Report for This Property
The Home Valuation Report is an in-depth analysis detailing your home's value as well as a comparison with similar homes in the area
Home Values in the Area
Average Home Value in this Area
Purchase History
| Date | Buyer | Sale Price | Title Company |
|---|---|---|---|
| Puma Mary Lou Li | $240,000 | Sunbelt Title Agency | |
| Howes Chris M | -- | Attorney | |
| Howe Chris M | $130,000 | Fidelity National Title Of | |
| Milliken James R | -- | Attorney |
Source: Public Records
Mortgage History
| Date | Status | Borrower | Loan Amount |
|---|---|---|---|
| Open | Puma Mary Lou Li | $192,000 |
Source: Public Records
Tax History Compared to Growth
Tax History
| Year | Tax Paid | Tax Assessment Tax Assessment Total Assessment is a certain percentage of the fair market value that is determined by local assessors to be the total taxable value of land and additions on the property. | Land | Improvement |
|---|---|---|---|---|
| 2024 | $6,266 | $455,110 | $355,994 | $99,116 |
| 2023 | $6,266 | $477,571 | $384,366 | $93,205 |
| 2022 | $5,438 | $378,581 | $308,093 | $70,488 |
| 2021 | $4,822 | $281,163 | $0 | $0 |
| 2020 | $4,416 | $249,035 | $0 | $0 |
| 2019 | $4,311 | $245,714 | $177,413 | $68,301 |
| 2018 | $3,907 | $215,716 | $0 | $0 |
| 2017 | $3,672 | $199,485 | $0 | $0 |
| 2016 | $1,853 | $135,336 | $0 | $0 |
| 2015 | $1,865 | $134,395 | $0 | $0 |
| 2014 | $1,825 | $133,328 | $0 | $0 |
Source: Public Records
Map
Nearby Homes