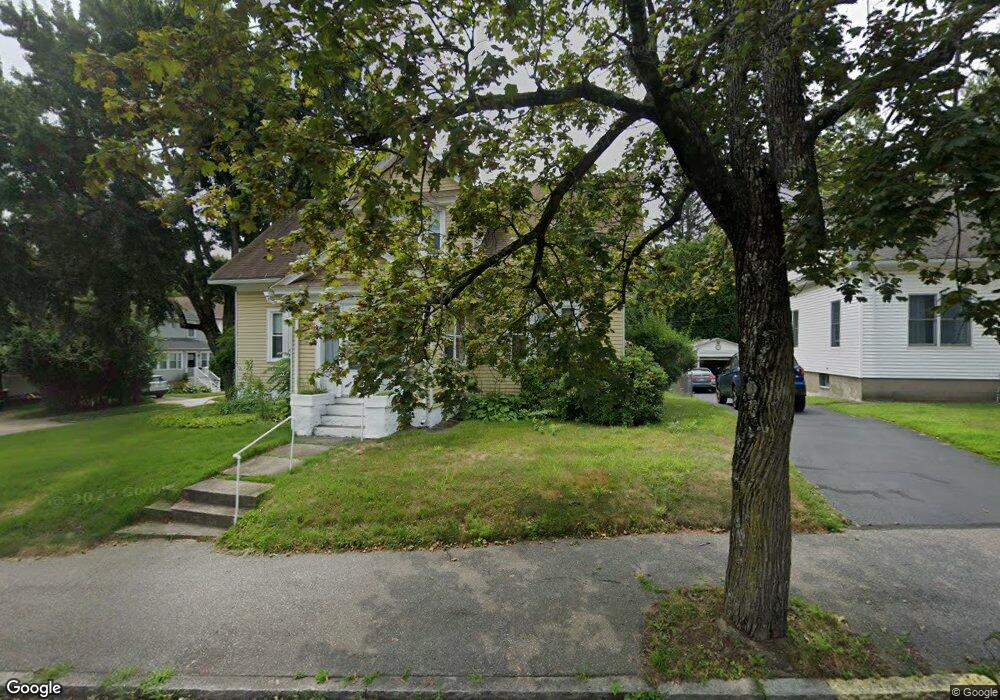
468 Chandler St Worcester, MA 01602
Newton Square NeighborhoodEstimated Value: $447,000 - $478,000
3
Beds
2
Baths
1,722
Sq Ft
$266/Sq Ft
Est. Value
About This Home
This home is located at 468 Chandler St, Worcester, MA 01602 and is currently estimated at $458,403, approximately $266 per square foot. 468 Chandler St is a home located in Worcester County with nearby schools including Chandler Magnet, Jacob Hiatt Magnet School, and May Street Elementary School.
Ownership History
Date
Name
Owned For
Owner Type
Purchase Details
Closed on
Aug 3, 2011
Sold by
Sinnott Valerie J and Quitadamo Valerie J
Bought by
Quitadamo Valerie J
Current Estimated Value
Home Financials for this Owner
Home Financials are based on the most recent Mortgage that was taken out on this home.
Original Mortgage
$151,100
Outstanding Balance
$104,327
Interest Rate
4.51%
Mortgage Type
Purchase Money Mortgage
Estimated Equity
$354,076
Purchase Details
Closed on
Dec 9, 1991
Sold by
Helmus Michael N
Bought by
Sinnott Valerie J
Create a Home Valuation Report for This Property
The Home Valuation Report is an in-depth analysis detailing your home's value as well as a comparison with similar homes in the area
Home Values in the Area
Average Home Value in this Area
Purchase History
| Date | Buyer | Sale Price | Title Company |
|---|---|---|---|
| Quitadamo Valerie J | -- | -- | |
| Sinnott Valerie J | $96,000 | -- |
Source: Public Records
Mortgage History
| Date | Status | Borrower | Loan Amount |
|---|---|---|---|
| Open | Quitadamo Valerie J | $151,100 | |
| Previous Owner | Sinnott Valerie J | $105,000 | |
| Previous Owner | Sinnott Valerie J | $101,000 | |
| Previous Owner | Sinnott Valerie J | $22,500 |
Source: Public Records
Tax History
| Year | Tax Paid | Tax Assessment Tax Assessment Total Assessment is a certain percentage of the fair market value that is determined by local assessors to be the total taxable value of land and additions on the property. | Land | Improvement |
|---|---|---|---|---|
| 2025 | $5,057 | $383,400 | $118,000 | $265,400 |
| 2024 | $4,956 | $360,400 | $118,000 | $242,400 |
| 2023 | $4,772 | $332,800 | $102,600 | $230,200 |
| 2022 | $4,379 | $287,900 | $82,100 | $205,800 |
| 2021 | $4,329 | $265,900 | $65,700 | $200,200 |
| 2020 | $4,243 | $249,600 | $65,700 | $183,900 |
| 2019 | $4,023 | $223,500 | $59,100 | $164,400 |
| 2018 | $4,016 | $212,400 | $59,100 | $153,300 |
| 2017 | $3,888 | $202,300 | $59,100 | $143,200 |
| 2016 | $3,879 | $188,200 | $43,100 | $145,100 |
| 2015 | $3,777 | $188,200 | $43,100 | $145,100 |
| 2014 | $3,672 | $187,900 | $43,100 | $144,800 |
Source: Public Records
Map
Nearby Homes
- 16 Sherwood Rd
- 9 Fiske St Unit A
- 4 Hartshorn Ave
- 24 Hadwen Rd
- 211 June St Unit 2
- 33 Carlisle St
- 60 June St
- 18 Hadwen Ln
- 24 Geneva St
- 28 Walworth St
- 108 Longfellow Rd
- 5 Franconia St
- 15 Longfellow Rd
- 19 Kenilworth Rd
- 34 Rosslare Dr Unit 108
- 73 Moore Ave
- 3A Chalmers Rd
- 6 Newton Ave
- 10 Minthorne St
- 47R Yarnie Unit 3A
Your Personal Tour Guide
Ask me questions while you tour the home.