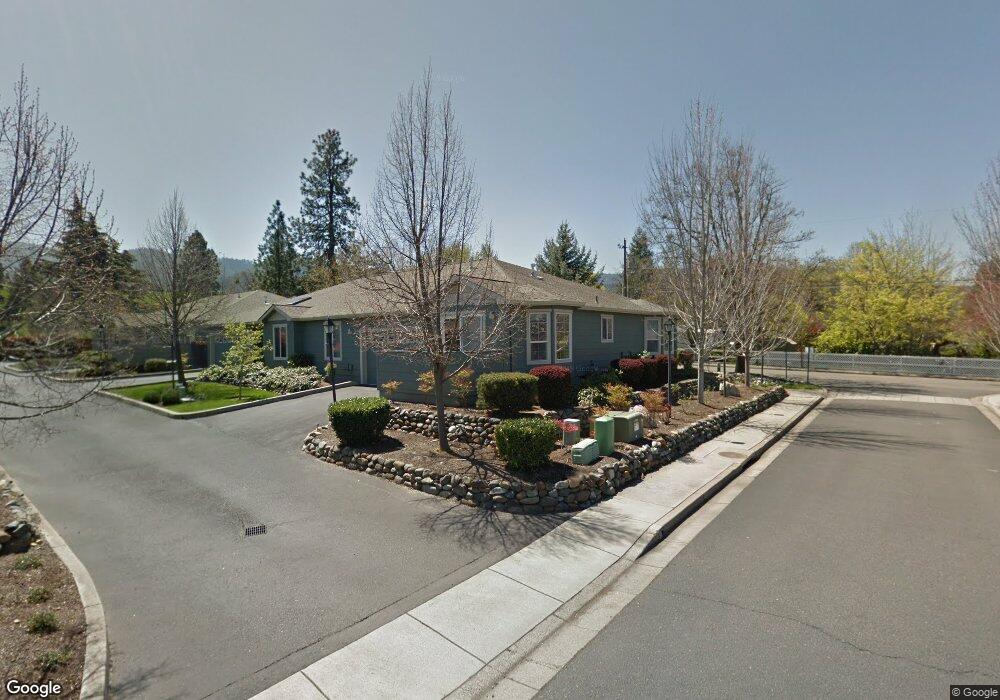
468 Clay St Ashland, OR 97520
Croman Mill NeighborhoodEstimated Value: $420,000 - $466,000
2
Beds
2
Baths
1,456
Sq Ft
$304/Sq Ft
Est. Value
About This Home
This home is located at 468 Clay St, Ashland, OR 97520 and is currently estimated at $442,707, approximately $304 per square foot. 468 Clay St is a home located in Jackson County with nearby schools including Bellview Elementary School, Ashland Middle School, and Ashland High School.
Ownership History
Date
Name
Owned For
Owner Type
Purchase Details
Closed on
May 29, 2003
Sold by
Charter Joseph M
Bought by
Banke Theodore H and Banke Lois E
Current Estimated Value
Purchase Details
Closed on
Jan 3, 2001
Sold by
Adams Group Llc
Bought by
Charter Joseph M
Home Financials for this Owner
Home Financials are based on the most recent Mortgage that was taken out on this home.
Original Mortgage
$143,100
Interest Rate
7.71%
Create a Home Valuation Report for This Property
The Home Valuation Report is an in-depth analysis detailing your home's value as well as a comparison with similar homes in the area
Home Values in the Area
Average Home Value in this Area
Purchase History
| Date | Buyer | Sale Price | Title Company |
|---|---|---|---|
| Banke Theodore H | $207,000 | Lawyers Title Insurance Corp | |
| Charter Joseph M | $178,900 | Amerititle |
Source: Public Records
Mortgage History
| Date | Status | Borrower | Loan Amount |
|---|---|---|---|
| Previous Owner | Charter Joseph M | $143,100 |
Source: Public Records
Tax History Compared to Growth
Tax History
| Year | Tax Paid | Tax Assessment Tax Assessment Total Assessment is a certain percentage of the fair market value that is determined by local assessors to be the total taxable value of land and additions on the property. | Land | Improvement |
|---|---|---|---|---|
| 2025 | $5,034 | $324,710 | $127,040 | $197,670 |
| 2024 | $5,034 | $315,260 | $123,340 | $191,920 |
| 2023 | $4,870 | $306,080 | $119,750 | $186,330 |
| 2022 | $4,714 | $306,080 | $119,750 | $186,330 |
| 2021 | $4,554 | $297,170 | $116,270 | $180,900 |
| 2020 | $4,426 | $288,520 | $112,890 | $175,630 |
| 2019 | $4,356 | $271,970 | $106,430 | $165,540 |
| 2018 | $4,115 | $264,050 | $103,330 | $160,720 |
| 2017 | $4,085 | $264,050 | $103,330 | $160,720 |
| 2016 | $3,979 | $248,900 | $97,400 | $151,500 |
| 2015 | $3,825 | $248,900 | $97,400 | $151,500 |
| 2014 | $3,701 | $234,630 | $91,800 | $142,830 |
Source: Public Records
Map
Nearby Homes
- 2663 Takelma Way
- 267 Meadow Dr
- 295 Tolman Creek Rd Unit 1
- 233 Clay St
- 369 Meadow Dr
- 215 Tolman Creek Rd Unit 17
- 215 Tolman Creek Rd Unit SPC 10
- 2096 Creek Dr
- 700 Clay St
- 0 Tolman Cr Rd Unit 220204970
- 635 Park St
- 75 Brooks Ln
- 740 Park St
- 138 Crocker St
- 750 Park St
- 63 Crocker St
- 510 Washington St
- 694 Normal Ave
- 48 Crocker St
- 620 Ray Ln
- 2128 Birchwood Ln
- 2116 Birchwood Ln
- 484 Clay St
- 460 Clay St
- 2109 Birchwood Ln
- 2124 Birchwood Ln
- 2117 Birchwood Ln
- 2132 Birchwood Ln
- 2125 Birchwood Ln
- 2140 Birchwood Ln
- 2133 Birchwood Ln
- 400 Clay St
- 2148 Birchwood Ln
- 2141 Birchwood Ln
- 2156 Birchwood Ln
- 2149 Birchwood Ln
- 410 Clay St
- 2164 Birchwood Ln
- 2172 Birchwood Ln
- 2157 Birchwood Ln