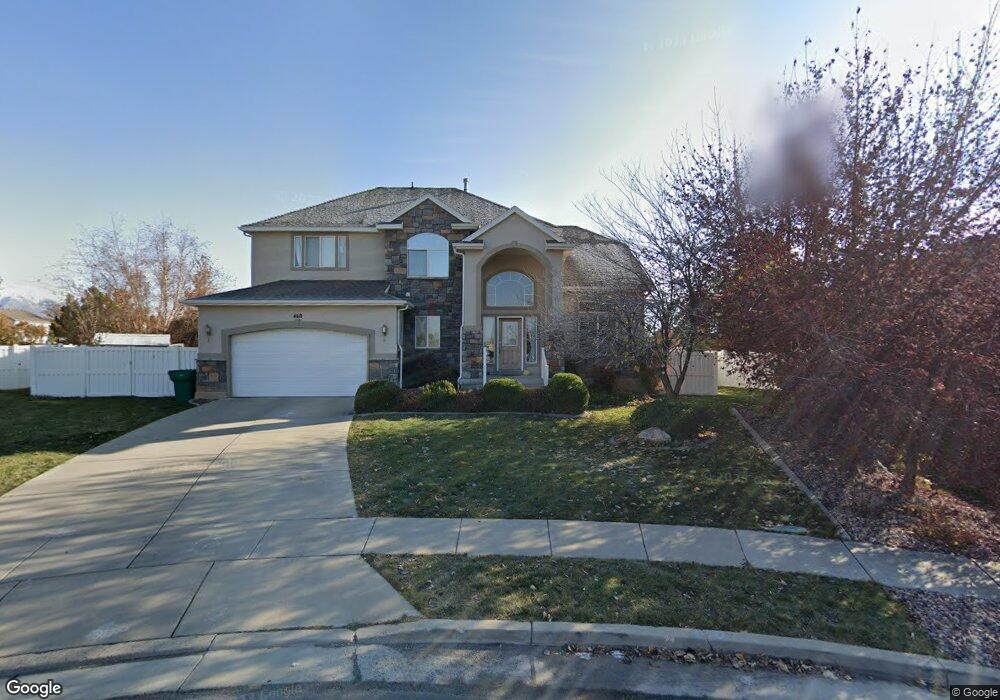
468 E 2025 S Clearfield, UT 84015
Estimated Value: $556,000 - $586,000
4
Beds
3
Baths
3,811
Sq Ft
$149/Sq Ft
Est. Value
About This Home
This home is located at 468 E 2025 S, Clearfield, UT 84015 and is currently estimated at $569,696, approximately $149 per square foot. 468 E 2025 S is a home located in Davis County with nearby schools including Antelope Elementary School, North Davis Junior High School, and Clearfield High School.
Ownership History
Date
Name
Owned For
Owner Type
Purchase Details
Closed on
Sep 24, 2020
Sold by
Moon Lafe C
Bought by
Moon Lafe C and Moon Melinda G
Current Estimated Value
Home Financials for this Owner
Home Financials are based on the most recent Mortgage that was taken out on this home.
Original Mortgage
$197,500
Outstanding Balance
$168,544
Interest Rate
2.9%
Mortgage Type
New Conventional
Estimated Equity
$401,152
Purchase Details
Closed on
Apr 5, 2016
Sold by
Moon Lafe C and Moon Melinda G
Bought by
Moon Lafe C
Purchase Details
Closed on
Aug 28, 2003
Sold by
Gmw Development Inc
Bought by
Moon Lafe C and Moon Melinda G
Home Financials for this Owner
Home Financials are based on the most recent Mortgage that was taken out on this home.
Original Mortgage
$212,945
Interest Rate
4.62%
Mortgage Type
Purchase Money Mortgage
Create a Home Valuation Report for This Property
The Home Valuation Report is an in-depth analysis detailing your home's value as well as a comparison with similar homes in the area
Home Values in the Area
Average Home Value in this Area
Purchase History
| Date | Buyer | Sale Price | Title Company |
|---|---|---|---|
| Moon Lafe C | -- | Accommodation | |
| Moon Lafe C | -- | First American Title | |
| Moon Lafe C | -- | Liberty Title | |
| Moon Lafe C | -- | Liberty Title | |
| Moon Lafe C | -- | Bonneville Title Company Inc |
Source: Public Records
Mortgage History
| Date | Status | Borrower | Loan Amount |
|---|---|---|---|
| Open | Moon Lafe C | $197,500 | |
| Previous Owner | Moon Lafe C | $212,945 |
Source: Public Records
Tax History
| Year | Tax Paid | Tax Assessment Tax Assessment Total Assessment is a certain percentage of the fair market value that is determined by local assessors to be the total taxable value of land and additions on the property. | Land | Improvement |
|---|---|---|---|---|
| 2025 | $3,333 | $298,650 | $78,948 | $219,702 |
| 2024 | $3,217 | $290,400 | $75,455 | $214,945 |
| 2023 | $3,072 | $509,000 | $120,444 | $388,556 |
| 2022 | $3,480 | $311,850 | $68,688 | $243,162 |
| 2021 | $3,043 | $412,000 | $74,563 | $337,437 |
| 2020 | $2,640 | $355,000 | $62,994 | $292,006 |
| 2019 | $2,539 | $337,000 | $64,962 | $272,038 |
| 2018 | $2,351 | $304,000 | $54,915 | $249,085 |
| 2016 | $2,119 | $143,275 | $22,033 | $121,242 |
| 2015 | $2,096 | $135,080 | $22,033 | $113,047 |
| 2014 | $2,132 | $139,304 | $22,033 | $117,271 |
| 2013 | -- | $141,798 | $37,125 | $104,673 |
Source: Public Records
Map
Nearby Homes
- 2127 S 350 E
- 308 E 1925 S
- 460 E 1700 S Unit 1 & 2
- 1477 N 2375 W
- 1250 N 2925 W
- 154 E 2325 S
- 1445 N 2925 W
- 2057 S James Cir
- 1961 S 100 W
- 2601 S 200 E
- 1916 N Celia Way
- 2480 S Main St
- 1141 N 2275 W
- 1818 S 200 W
- 1740 N Gregory Dr
- 1491 N 1875 W
- 1491 N 1875 W Unit 158
- 1487 N 1875 W
- 1487 N 1875 W Unit 159
- 1483 N 1875 W