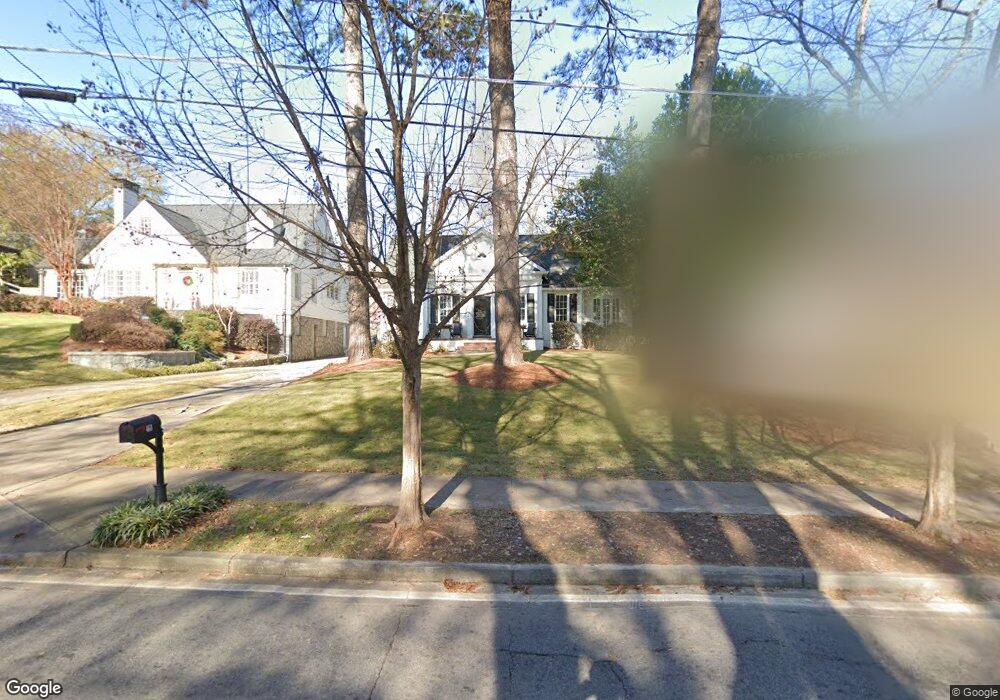
468 E Wesley Rd NE Atlanta, GA 30305
Garden Hills NeighborhoodEstimated Value: $1,148,920 - $1,406,000
4
Beds
3
Baths
3,046
Sq Ft
$425/Sq Ft
Est. Value
About This Home
This home is located at 468 E Wesley Rd NE, Atlanta, GA 30305 and is currently estimated at $1,294,480, approximately $424 per square foot. 468 E Wesley Rd NE is a home located in Fulton County with nearby schools including Garden Hills Elementary School, Sutton Middle School, and North Atlanta High School.
Ownership History
Date
Name
Owned For
Owner Type
Purchase Details
Closed on
Nov 30, 2018
Sold by
Maxwell Kevin A
Bought by
Helfrich Carl Edward and Hammond Andrea H
Current Estimated Value
Home Financials for this Owner
Home Financials are based on the most recent Mortgage that was taken out on this home.
Original Mortgage
$453,100
Outstanding Balance
$395,667
Interest Rate
4.8%
Mortgage Type
New Conventional
Estimated Equity
$898,813
Purchase Details
Closed on
Jun 30, 2011
Sold by
Jurgovan Jon M and Jurgovan Ellen K
Bought by
Maxwell Kevin A and Maxwell Whitney T
Home Financials for this Owner
Home Financials are based on the most recent Mortgage that was taken out on this home.
Original Mortgage
$370,000
Interest Rate
4.62%
Mortgage Type
New Conventional
Purchase Details
Closed on
Sep 16, 1994
Sold by
Kunkle Camille F
Bought by
Jurgovan Jon M Ellen K
Home Financials for this Owner
Home Financials are based on the most recent Mortgage that was taken out on this home.
Original Mortgage
$176,000
Interest Rate
8.51%
Create a Home Valuation Report for This Property
The Home Valuation Report is an in-depth analysis detailing your home's value as well as a comparison with similar homes in the area
Home Values in the Area
Average Home Value in this Area
Purchase History
| Date | Buyer | Sale Price | Title Company |
|---|---|---|---|
| Helfrich Carl Edward | $785,000 | -- | |
| Maxwell Kevin A | $475,000 | -- | |
| Jurgovan Jon M Ellen K | $276,000 | -- |
Source: Public Records
Mortgage History
| Date | Status | Borrower | Loan Amount |
|---|---|---|---|
| Open | Helfrich Carl Edward | $453,100 | |
| Previous Owner | Maxwell Kevin A | $370,000 | |
| Previous Owner | Jurgovan Jon M Ellen K | $176,000 |
Source: Public Records
Tax History Compared to Growth
Tax History
| Year | Tax Paid | Tax Assessment Tax Assessment Total Assessment is a certain percentage of the fair market value that is determined by local assessors to be the total taxable value of land and additions on the property. | Land | Improvement |
|---|---|---|---|---|
| 2025 | $12,061 | $412,960 | $191,000 | $221,960 |
| 2023 | $15,653 | $378,080 | $156,680 | $221,400 |
| 2022 | $13,188 | $325,880 | $124,920 | $200,960 |
| 2021 | $2,855 | $299,280 | $127,760 | $171,520 |
| 2020 | $11,608 | $283,360 | $85,960 | $197,400 |
| 2019 | $488 | $294,480 | $73,800 | $220,680 |
| 2018 | $6,687 | $190,000 | $105,720 | $84,280 |
| 2017 | $8,937 | $190,000 | $105,720 | $84,280 |
| 2016 | $6,981 | $190,000 | $105,720 | $84,280 |
| 2015 | $7,002 | $190,000 | $105,720 | $84,280 |
| 2014 | $7,304 | $190,000 | $105,720 | $84,280 |
Source: Public Records
Map
Nearby Homes
- 400 Pine Tree Dr NE
- 566 E Wesley Rd NE
- 2707 Sharondale Dr NE
- 557 E Wesley Rd NE
- 405 Brentwood Dr NE
- 2837 N Hills Dr NE
- 2836 Alpine Rd NE
- 2840 Alpine Rd NE
- 2742 Alpine Rd NE
- 2901 N Hills Dr NE
- 273 Peachtree Way NE
- 424 Lindbergh Dr NE Unit 208
- 2662 Forrest Way NE
- 339 Peachtree Ave NE
- 224 Peachtree Way NE
- 284 Lakeview Ave NE
- 2520 Parkdale Place NE Unit 2
- 2681 Brookwood Dr NE
- 430 Lindbergh Dr NE Unit H2
- 474 E Wesley Rd NE
- 460 E Wesley Rd NE
- 480 E Wesley Rd NE
- 2721 N Hills Dr NE
- 2727 N Hills Dr NE
- 2735 N Hills Dr NE
- 2732 Atwood Rd NE
- 2718 Atwood Rd NE
- 461 Pine Tree Dr NE
- 2741 N Hills Dr NE
- 2724 Atwood Rd NE
- 2741 Atwood Rd NE
- 463 E Wesley Rd NE
- 469 E Wesley Rd NE
- 453 E Wesley Rd NE
- 479 E Wesley Rd NE
- 451 Pine Tree Dr NE
- 481 Pine Tree Dr NE
- 2720 N Hills Dr NE