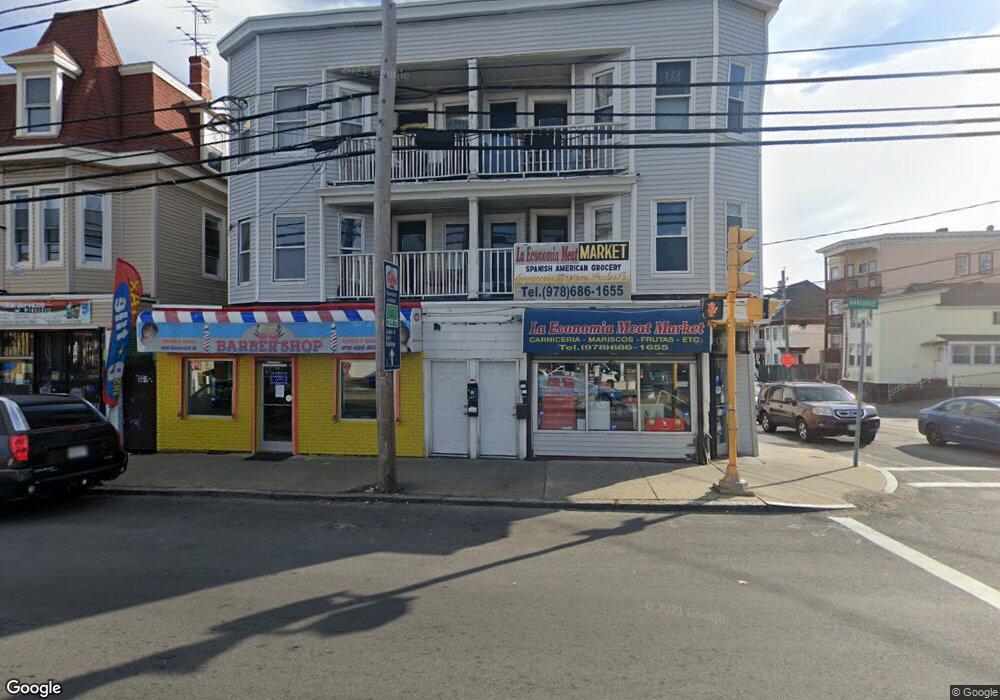
468 Haverhill St Unit 474 Lawrence, MA 01841
Tower Hill NeighborhoodEstimated Value: $475,869
8
Beds
7
Baths
6,139
Sq Ft
$78/Sq Ft
Est. Value
About This Home
This home is located at 468 Haverhill St Unit 474, Lawrence, MA 01841 and is currently priced at $475,869, approximately $77 per square foot. 468 Haverhill St Unit 474 is a home located in Essex County with nearby schools including Cass Lake-Bena Elementary School, Olive Branch Elementary School, and James F. Hennessey School.
Ownership History
Date
Name
Owned For
Owner Type
Purchase Details
Closed on
Apr 27, 2011
Sold by
Ib Prop Holdings Llc
Bought by
Haskaj Thodhori and Haskaj Natasha
Current Estimated Value
Home Financials for this Owner
Home Financials are based on the most recent Mortgage that was taken out on this home.
Original Mortgage
$160,000
Outstanding Balance
$109,780
Interest Rate
4.76%
Mortgage Type
Commercial
Purchase Details
Closed on
Aug 3, 2010
Sold by
Marte Carlos R and Bayview Loan Svcng Llc
Bought by
Ib Property Holdings L
Purchase Details
Closed on
Dec 8, 2005
Sold by
Mejia Flavio
Bought by
Marte Carlos
Home Financials for this Owner
Home Financials are based on the most recent Mortgage that was taken out on this home.
Original Mortgage
$292,000
Interest Rate
6.17%
Mortgage Type
Commercial
Create a Home Valuation Report for This Property
The Home Valuation Report is an in-depth analysis detailing your home's value as well as a comparison with similar homes in the area
Home Values in the Area
Average Home Value in this Area
Purchase History
| Date | Buyer | Sale Price | Title Company |
|---|---|---|---|
| Haskaj Thodhori | $215,000 | -- | |
| Haskaj Thodhori | $215,000 | -- | |
| Ib Property Holdings L | $185,500 | -- | |
| Ib Property Holdings L | $185,500 | -- | |
| Marte Carlos | $365,000 | -- | |
| Marte Carlos | $365,000 | -- |
Source: Public Records
Mortgage History
| Date | Status | Borrower | Loan Amount |
|---|---|---|---|
| Open | Marte Carlos | $160,000 | |
| Closed | Marte Carlos | $160,000 | |
| Previous Owner | Marte Carlos | $292,000 | |
| Previous Owner | Marte Carlos | $143,934 |
Source: Public Records
Tax History Compared to Growth
Tax History
| Year | Tax Paid | Tax Assessment Tax Assessment Total Assessment is a certain percentage of the fair market value that is determined by local assessors to be the total taxable value of land and additions on the property. | Land | Improvement |
|---|---|---|---|---|
| 2025 | -- | $843,800 | $154,500 | $689,300 |
| 2024 | -- | $737,700 | $97,600 | $640,100 |
| 2023 | $0 | $650,900 | $94,200 | $556,700 |
| 2022 | $0 | $506,300 | $88,800 | $417,500 |
| 2021 | $0 | $437,300 | $88,800 | $348,500 |
| 2020 | $6,488 | $419,100 | $74,000 | $345,100 |
| 2019 | $0 | $347,200 | $55,000 | $292,200 |
| 2018 | $0 | $315,600 | $49,800 | $265,800 |
| 2017 | -- | $301,500 | $47,200 | $254,300 |
| 2016 | -- | $278,300 | $36,900 | $241,400 |
| 2015 | -- | $278,300 | $36,900 | $241,400 |
Source: Public Records
Map
Nearby Homes
- 42 Morton St
- 499 Haverhill St
- 50 Forest St
- 44-46 Butler St
- 62-66 Butler St
- 70 Butler St
- 202 Broadway Unit 2-3
- 202 Broadway Unit 3-3
- 139 West St
- 2 Washington St
- 45 Bodwell St
- 179-181 West St
- 30-32 Linden St
- 265 Ames St
- 82 Water St
- 1008 Essex St Unit 1010
- 55-59 Water St
- 2 Maurice Ave
- 47 Hallenan Ave
- 68 Middlebury St
- 464 Haverhill St Unit 466
- 167 Margin St
- 460 Haverhill St Unit 462
- 476 1/2 Haverhill St
- 1 Haverhill St
- 476 Haverhill St
- 476 Haverhill St
- 456 Haverhill St
- 456 Haverhill St Unit 3
- 456 Haverhill St Unit . 3
- 164 Margin St
- 478 Haverhill St
- 478 Haverhill St
- 459-461 Haverhill St
- 459 Haverhill St Unit 461
- 452-454 Haverhill St `
- 157 Margin St
- 452 Haverhill St Unit 3
- 452 Haverhill St Unit 2B
- 452 Haverhill St Unit 454