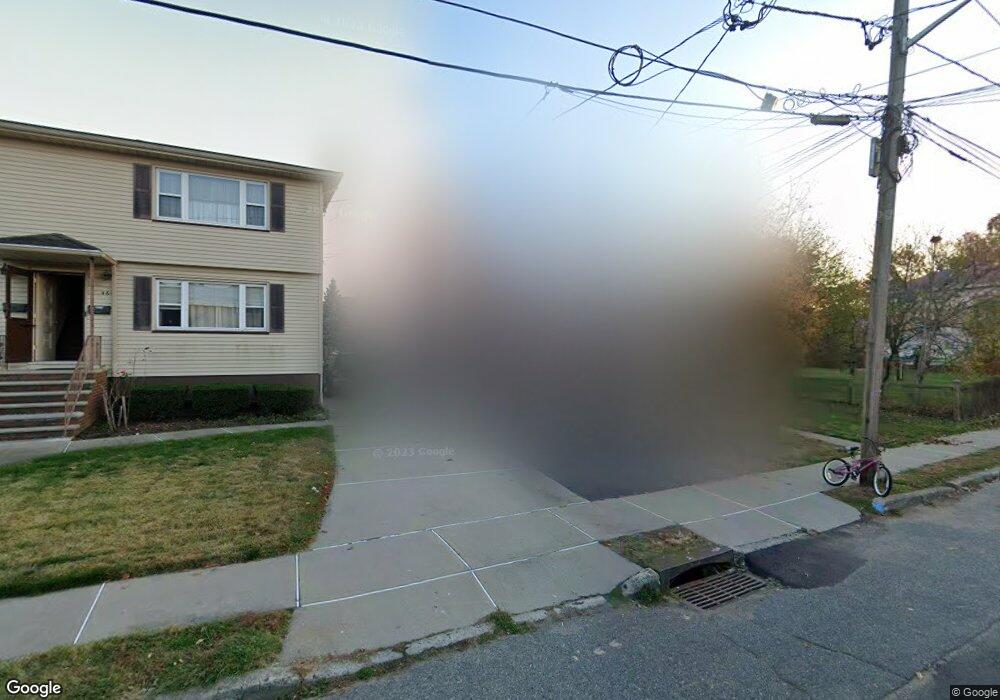
468 Hobson Ave Unit 2 Saddle Brook, NJ 07663
Estimated Value: $833,220 - $1,091,000
2
Beds
1
Bath
2,918
Sq Ft
$331/Sq Ft
Est. Value
About This Home
This home is located at 468 Hobson Ave Unit 2, Saddle Brook, NJ 07663 and is currently estimated at $967,305, approximately $331 per square foot. 468 Hobson Ave Unit 2 is a home located in Bergen County with nearby schools including Saddle Brook Mid High School and St. Leo Elementary School.
Ownership History
Date
Name
Owned For
Owner Type
Purchase Details
Closed on
Jun 13, 2017
Sold by
Daniel M Kelly
Bought by
Mrkulic Samir
Current Estimated Value
Home Financials for this Owner
Home Financials are based on the most recent Mortgage that was taken out on this home.
Original Mortgage
$449,735
Outstanding Balance
$372,746
Interest Rate
3.89%
Estimated Equity
$594,559
Purchase Details
Closed on
Jun 24, 2014
Sold by
468 Hobson Avenue Llc
Bought by
Kelly Daniel M and Kelly Catherine
Home Financials for this Owner
Home Financials are based on the most recent Mortgage that was taken out on this home.
Original Mortgage
$345,600
Interest Rate
4.12%
Mortgage Type
New Conventional
Purchase Details
Closed on
Jan 31, 2003
Sold by
Estate Of Regina D Kersten
Bought by
Corrubia William A and Corrubia Geraldine K
Purchase Details
Closed on
Dec 12, 1997
Sold by
Kersten Regina D
Bought by
Corrubia Geraldine K and Golden Amelia A
Create a Home Valuation Report for This Property
The Home Valuation Report is an in-depth analysis detailing your home's value as well as a comparison with similar homes in the area
Home Values in the Area
Average Home Value in this Area
Purchase History
| Date | Buyer | Sale Price | Title Company |
|---|---|---|---|
| Mrkulic Samir | $522,000 | -- | |
| Kelly Daniel M | -- | -- | |
| Corrubia William A | -- | -- | |
| Corrubia Geraldine K | -- | -- | |
| Kersten Regina D | -- | -- |
Source: Public Records
Mortgage History
| Date | Status | Borrower | Loan Amount |
|---|---|---|---|
| Open | Mrkulic Samir | $449,735 | |
| Closed | Mrkulic Samir | -- | |
| Previous Owner | Kelly Daniel M | $345,600 |
Source: Public Records
Tax History
| Year | Tax Paid | Tax Assessment Tax Assessment Total Assessment is a certain percentage of the fair market value that is determined by local assessors to be the total taxable value of land and additions on the property. | Land | Improvement |
|---|---|---|---|---|
| 2025 | $15,095 | $672,800 | $234,100 | $438,700 |
| 2024 | $13,682 | $654,600 | $229,600 | $425,000 |
| 2023 | $13,360 | $585,700 | $218,100 | $367,600 |
| 2022 | $13,360 | $556,200 | $205,200 | $351,000 |
| 2021 | $13,530 | $519,600 | $188,800 | $330,800 |
| 2020 | $12,991 | $504,500 | $184,300 | $320,200 |
| 2019 | $12,955 | $499,600 | $181,300 | $318,300 |
| 2018 | $12,672 | $499,500 | $183,300 | $316,200 |
| 2017 | $10,369 | $402,200 | $180,300 | $221,900 |
| 2016 | $10,959 | $382,500 | $170,300 | $212,200 |
| 2015 | $10,385 | $382,500 | $170,300 | $212,200 |
| 2014 | $10,022 | $382,500 | $170,300 | $212,200 |
Source: Public Records
Map
Nearby Homes
- 21 Sampson St
- 520 Victor St Unit 42
- 520 Victor St Unit 8
- 88 Fournier Crescent
- 466 Market St Unit 468
- 2 Meyer St
- 80 Caruth Ave
- 113 Cory Ln
- 132 Cory Ln Unit C0132
- 134 Cory Ln
- 82 Birk St
- 128 Bell Ave
- 281 Cory Ln
- 4142 Cory Ln
- 485 Saddle River Rd Unit 13
- 351 Woodcrest Place
- 413 Lanza Ave
- 152 Claremont Ave
- 389 Madeline Ave
- 66 Jamros Terrace
- 468 Hobson Ave
- 464 Hobson Ave
- 460 Hobson Ave
- 460 Hobson Ave Unit 2nd flr
- 467 Dewey Ave
- 463 Dewey Ave
- 463 Dewey Ave Unit 1
- 463 Dewey Ave Unit 2
- 459 Dewey Ave
- 459 Dewey Ave Unit 1st Fl
- 459 Dewey Ave Unit 2nd Fl
- 459 Dewey Ave Unit 2nd Floor
- 480 Hobson Ave
- 467 Hobson Ave Unit 2
- 467 Hobson Ave
- 471 Hobson Ave
- 422 Steinway Rd
- 463 Hobson Ave Unit 2
- 463 Hobson Ave
- 463 Hobson Ave Unit 1st floor
Your Personal Tour Guide
Ask me questions while you tour the home.