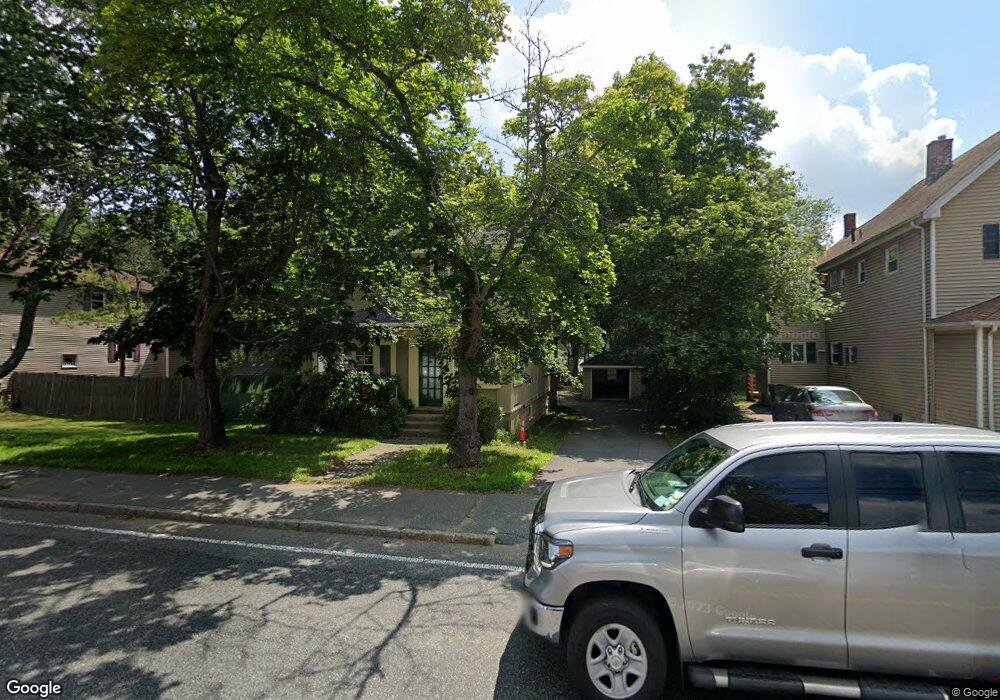
468 Hollis St Framingham, MA 01702
Estimated Value: $526,000 - $667,000
4
Beds
2
Baths
1,664
Sq Ft
$355/Sq Ft
Est. Value
About This Home
This home is located at 468 Hollis St, Framingham, MA 01702 and is currently estimated at $590,640, approximately $354 per square foot. 468 Hollis St is a home located in Middlesex County with nearby schools including Framingham High School, Happy Hollow School, and Pincushion Hill Montessori School.
Ownership History
Date
Name
Owned For
Owner Type
Purchase Details
Closed on
Aug 31, 2007
Sold by
Barrientos Luz A and Quinteros-Barrientos Luz
Bought by
Quinteros Luz A and Quinteros Norberto A
Current Estimated Value
Home Financials for this Owner
Home Financials are based on the most recent Mortgage that was taken out on this home.
Original Mortgage
$211,500
Outstanding Balance
$134,865
Interest Rate
6.71%
Mortgage Type
Purchase Money Mortgage
Estimated Equity
$455,775
Purchase Details
Closed on
Aug 26, 2002
Sold by
Lucas David E and Lucas Elaine M
Bought by
Barrientos Luz A
Home Financials for this Owner
Home Financials are based on the most recent Mortgage that was taken out on this home.
Original Mortgage
$232,750
Interest Rate
6.57%
Mortgage Type
Purchase Money Mortgage
Create a Home Valuation Report for This Property
The Home Valuation Report is an in-depth analysis detailing your home's value as well as a comparison with similar homes in the area
Home Values in the Area
Average Home Value in this Area
Purchase History
| Date | Buyer | Sale Price | Title Company |
|---|---|---|---|
| Quinteros Luz A | -- | -- | |
| Quinteros Luz A | -- | -- | |
| Barrientos Luz A | $245,000 | -- | |
| Barrientos Luz A | $245,000 | -- |
Source: Public Records
Mortgage History
| Date | Status | Borrower | Loan Amount |
|---|---|---|---|
| Open | Quinteros Luz A | $211,500 | |
| Closed | Barrientos Luz A | $211,500 | |
| Previous Owner | Barrientos Luz A | $232,750 | |
| Previous Owner | Barrientos Luz A | $2,691 |
Source: Public Records
Tax History Compared to Growth
Tax History
| Year | Tax Paid | Tax Assessment Tax Assessment Total Assessment is a certain percentage of the fair market value that is determined by local assessors to be the total taxable value of land and additions on the property. | Land | Improvement |
|---|---|---|---|---|
| 2025 | $5,852 | $490,100 | $203,600 | $286,500 |
| 2024 | $5,565 | $446,600 | $181,100 | $265,500 |
| 2023 | $5,381 | $411,100 | $161,800 | $249,300 |
| 2022 | $5,045 | $367,200 | $146,800 | $220,400 |
| 2021 | $4,915 | $349,800 | $141,000 | $208,800 |
| 2020 | $4,834 | $322,700 | $122,900 | $199,800 |
| 2019 | $4,671 | $303,700 | $117,100 | $186,600 |
| 2018 | $4,522 | $277,100 | $109,000 | $168,100 |
| 2017 | $4,291 | $256,800 | $105,000 | $151,800 |
| 2016 | $4,030 | $231,900 | $99,300 | $132,600 |
| 2015 | $3,762 | $211,100 | $100,300 | $110,800 |
Source: Public Records
Map
Nearby Homes
- 36 Bates Rd
- 15 Bates Rd
- 69 Whitney Ave
- 11 Gilbert St
- 302 Hollis St Unit R
- 131 Mellen St Unit 3B
- 292 Hollis St
- 143 Arlington St
- 25 Eames St
- 96 Arlington St
- 39 Bethany Rd
- 77 Arlington St
- 27 Gordon St Unit 206
- 29 Gordon St Unit 104
- 26 Wilde Ave
- 181 E Union St
- 818 Waverly St
- 26 Wenzell Rd
- 848 Waverly St
- 20 Mulhall Dr