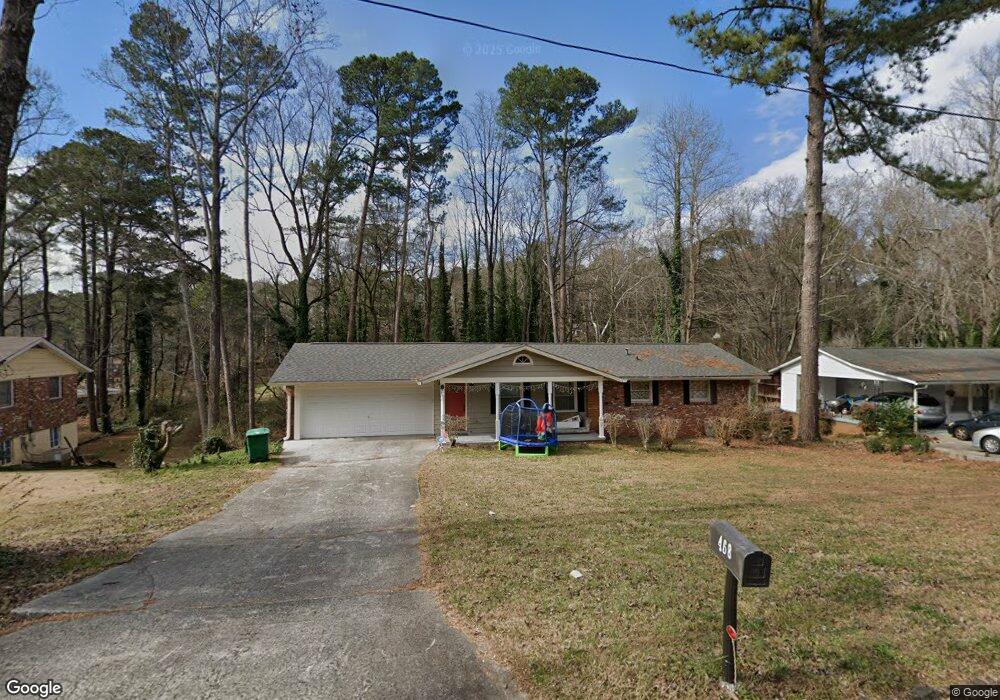
468 Kenridge Cir Unit 9-C Stone Mountain, GA 30083
Estimated Value: $212,000 - $286,000
3
Beds
2
Baths
1,274
Sq Ft
$196/Sq Ft
Est. Value
About This Home
This home is located at 468 Kenridge Cir Unit 9-C, Stone Mountain, GA 30083 and is currently estimated at $249,769, approximately $196 per square foot. 468 Kenridge Cir Unit 9-C is a home located in DeKalb County with nearby schools including Allgood Elementary School, Freedom Middle School, and Clarkston High School.
Ownership History
Date
Name
Owned For
Owner Type
Purchase Details
Closed on
Feb 4, 2022
Sold by
Edge Charles
Bought by
Gonzalez Yolanda Gongora and Ordonez Alberto Hernandez
Current Estimated Value
Home Financials for this Owner
Home Financials are based on the most recent Mortgage that was taken out on this home.
Original Mortgage
$235,653
Outstanding Balance
$218,404
Interest Rate
3.55%
Mortgage Type
FHA
Estimated Equity
$31,365
Purchase Details
Closed on
Sep 26, 2016
Sold by
Hedge Equity Residential Llc
Bought by
Edge Charles
Home Financials for this Owner
Home Financials are based on the most recent Mortgage that was taken out on this home.
Original Mortgage
$127,000
Interest Rate
3.43%
Mortgage Type
New Conventional
Purchase Details
Closed on
Feb 24, 2016
Sold by
Chamer Mary Lewis
Bought by
Hedge Equity Residential Llc
Create a Home Valuation Report for This Property
The Home Valuation Report is an in-depth analysis detailing your home's value as well as a comparison with similar homes in the area
Home Values in the Area
Average Home Value in this Area
Purchase History
| Date | Buyer | Sale Price | Title Company |
|---|---|---|---|
| Gonzalez Yolanda Gongora | $240,000 | -- | |
| Edge Charles | $127,000 | -- | |
| Hedge Equity Residential Llc | $36,077 | -- |
Source: Public Records
Mortgage History
| Date | Status | Borrower | Loan Amount |
|---|---|---|---|
| Open | Gonzalez Yolanda Gongora | $235,653 | |
| Previous Owner | Edge Charles | $127,000 |
Source: Public Records
Tax History Compared to Growth
Tax History
| Year | Tax Paid | Tax Assessment Tax Assessment Total Assessment is a certain percentage of the fair market value that is determined by local assessors to be the total taxable value of land and additions on the property. | Land | Improvement |
|---|---|---|---|---|
| 2025 | $4,653 | $96,000 | $23,040 | $72,960 |
| 2024 | $4,651 | $96,000 | $23,040 | $72,960 |
| 2023 | $4,651 | $96,000 | $23,040 | $72,960 |
| 2022 | $2,243 | $88,480 | $15,440 | $73,040 |
| 2021 | $1,708 | $65,280 | $15,440 | $49,840 |
| 2020 | $1,672 | $63,560 | $3,040 | $60,520 |
| 2019 | $1,503 | $56,440 | $3,040 | $53,400 |
| 2018 | $895 | $57,600 | $3,040 | $54,560 |
| 2017 | $454 | $14,440 | $840 | $13,600 |
| 2016 | $222 | $22,160 | $3,040 | $19,120 |
| 2014 | $101 | $10,240 | $3,040 | $7,200 |
Source: Public Records
Map
Nearby Homes
- 579 Kenridge Cir
- 570 Kenridge Cir
- 4210 Rockbridge Rd
- 4328 Rockbridge Rd
- 4096 Warrior Trail
- 4116 Warrior Trail Unit 2
- 494 Rue Montaigne
- 4250 Village Square Ln
- 4134 Blackhawk Dr
- 539 Rue Montaigne
- 613 Rays Rd
- 521 S Indian Creek Dr
- 550 S Rays (9 74 Acres) Rd
- 3943 Dunaire Dr
- 3925 Dunaire Dr
- 550 S Rays (8 6 Acres) Rd
- 573 Hambrick Square
- 550 S Rays Rd
- 3907 Dunaire Dr
- 468 Kenridge Cir
- 476 Kenridge Cir
- 460 Kenridge Cir
- 484 Kenridge Cir
- 452 Kenridge Cir
- 467 Kenridge Cir
- 459 Kenridge Cir
- 475 Kenridge Cir
- 492 Kenridge Cir
- 444 Kenridge Cir
- 483 Kenridge Cir
- 449 Kenridge Cir
- 495 Susan Creek Dr
- 489 Susan Creek Dr
- 500 Kenridge Cir
- 491 Kenridge Cir
- 503 Susan Creek Dr
- 441 Kenridge Cir
- 436 Kenridge Cir Unit II
- 573 Kenridge Cir