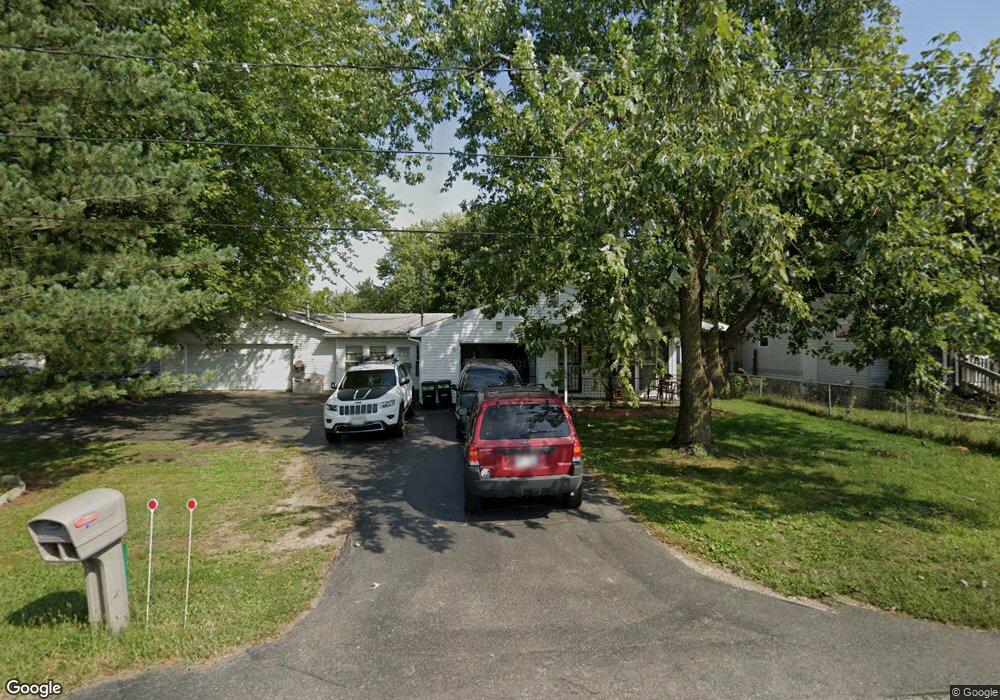
468 Osgood St Marion, OH 43302
Estimated Value: $183,008 - $224,000
3
Beds
2
Baths
1,558
Sq Ft
$127/Sq Ft
Est. Value
About This Home
This home is located at 468 Osgood St, Marion, OH 43302 and is currently estimated at $197,252, approximately $126 per square foot. 468 Osgood St is a home located in Marion County with nearby schools including William McKinley Elementary School, Ulysses S. Grant Middle School, and Harding High School.
Ownership History
Date
Name
Owned For
Owner Type
Purchase Details
Closed on
Jun 24, 2016
Sold by
Miley Robert and Drewsback Wanda M
Bought by
Dutton Brian C
Current Estimated Value
Home Financials for this Owner
Home Financials are based on the most recent Mortgage that was taken out on this home.
Original Mortgage
$73,641
Outstanding Balance
$57,990
Interest Rate
3.58%
Mortgage Type
FHA
Estimated Equity
$139,262
Purchase Details
Closed on
Mar 27, 2002
Bought by
Dutton Brian C
Purchase Details
Closed on
Oct 12, 1995
Bought by
Dutton Brian C
Create a Home Valuation Report for This Property
The Home Valuation Report is an in-depth analysis detailing your home's value as well as a comparison with similar homes in the area
Home Values in the Area
Average Home Value in this Area
Purchase History
We collect this data history from publicly available records. To have your information removed, we recommend requesting removal directly through your county’s website.
| Date | Buyer | Sale Price | Title Company |
|---|---|---|---|
| Dutton Brian C | $75,000 | None Available | |
| Dutton Brian C | -- | -- | |
| Dutton Brian C | -- | -- |
Source: Public Records
Mortgage History
We collect this data history from publicly available records. To have your information removed, we recommend requesting removal directly through your county’s website.
| Date | Status | Borrower | Loan Amount |
|---|---|---|---|
| Open | Dutton Brian C | $73,641 |
Source: Public Records
Tax History
| Year | Tax Paid | Tax Assessment Tax Assessment Total Assessment is a certain percentage of the fair market value that is determined by local assessors to be the total taxable value of land and additions on the property. | Land | Improvement |
|---|---|---|---|---|
| 2025 | $1,696 | $57,230 | $3,190 | $54,040 |
| 2024 | $1,696 | $44,230 | $3,080 | $41,150 |
| 2023 | $1,696 | $44,230 | $3,080 | $41,150 |
| 2022 | $1,575 | $44,230 | $3,080 | $41,150 |
| 2021 | $1,474 | $37,260 | $2,680 | $34,580 |
| 2020 | $1,477 | $37,260 | $2,680 | $34,580 |
| 2019 | $1,437 | $37,260 | $2,680 | $34,580 |
| 2018 | $1,071 | $27,800 | $2,680 | $25,120 |
| 2017 | $1,085 | $27,800 | $2,680 | $25,120 |
| 2016 | $1,110 | $27,800 | $2,680 | $25,120 |
| 2015 | $725 | $27,020 | $2,400 | $24,620 |
| 2014 | $727 | $27,020 | $2,400 | $24,620 |
| 2012 | $607 | $23,930 | $2,230 | $21,700 |
Source: Public Records
Map
Nearby Homes
- 1014 Henry St
- 927 Daffodil Dr
- 328 Thew Ave
- 1509 White Oaks Rd
- 224 Thew Ave
- 790 Merkle Ave
- 4 Poppy Place
- 839 Merkle Ave
- 1710 Smeltzer Rd
- 363 S Prospect St
- 797 Waples Ave
- 793 Congress St
- 681 Davids St
- 638 Miami St
- 862 Woodrow Ave
- 822 Congress St
- 863 Congress St
- 1006 Underwood South Dr
- 631 Girard Ave
- Tract 1-6 Southland Pkwy
Your Personal Tour Guide
Ask me questions while you tour the home.