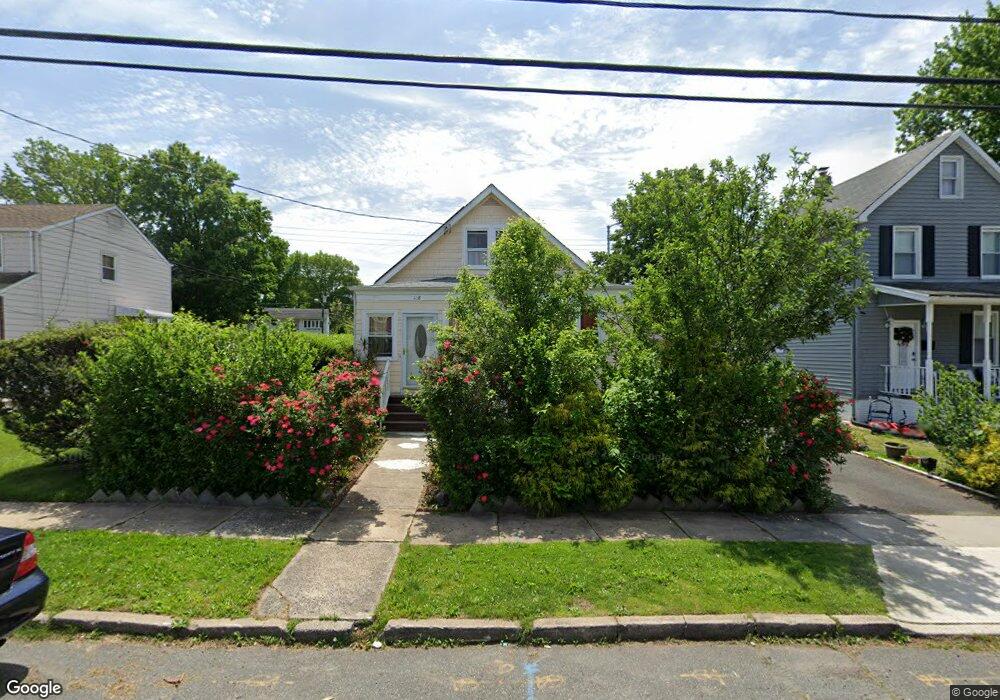
468 Robins St Roselle, NJ 07203
Estimated Value: $414,000 - $542,000
3
Beds
1
Bath
963
Sq Ft
$488/Sq Ft
Est. Value
About This Home
This home is located at 468 Robins St, Roselle, NJ 07203 and is currently estimated at $470,358, approximately $488 per square foot. 468 Robins St is a home located in Union County with nearby schools including Washington Elementary School, Leonard V. Moore Middle School, and Grace Wilday Junior High School.
Ownership History
Date
Name
Owned For
Owner Type
Purchase Details
Closed on
Jun 13, 2011
Sold by
Roseland Corporation
Bought by
So Larry and So Candace Aaron
Current Estimated Value
Home Financials for this Owner
Home Financials are based on the most recent Mortgage that was taken out on this home.
Original Mortgage
$146,197
Outstanding Balance
$101,351
Interest Rate
4.75%
Mortgage Type
FHA
Estimated Equity
$369,007
Purchase Details
Closed on
Sep 23, 2010
Sold by
Deutsch Bank National Trust Company
Bought by
Roseland Corporation
Purchase Details
Closed on
Apr 26, 2010
Sold by
Jimenez Maria Enol and Jiminez Enovis
Bought by
Deutsche Bank National Trust Company
Purchase Details
Closed on
Jan 20, 2006
Sold by
Nygard Ivor A
Bought by
Jimenez Maria Enol
Home Financials for this Owner
Home Financials are based on the most recent Mortgage that was taken out on this home.
Original Mortgage
$240,000
Interest Rate
8.12%
Mortgage Type
Adjustable Rate Mortgage/ARM
Purchase Details
Closed on
Nov 28, 2000
Sold by
Nygard Ivor A and Decker Christine J
Bought by
Nygard Ivor A
Create a Home Valuation Report for This Property
The Home Valuation Report is an in-depth analysis detailing your home's value as well as a comparison with similar homes in the area
Home Values in the Area
Average Home Value in this Area
Purchase History
| Date | Buyer | Sale Price | Title Company |
|---|---|---|---|
| So Larry | $150,000 | Chicago Title Insurance Co | |
| Roseland Corporation | $80,000 | Sutton Land Title Agency | |
| Deutsche Bank National Trust Company | -- | None Available | |
| Jimenez Maria Enol | $240,000 | -- | |
| Nygard Ivor A | -- | -- |
Source: Public Records
Mortgage History
| Date | Status | Borrower | Loan Amount |
|---|---|---|---|
| Open | So Larry | $146,197 | |
| Previous Owner | Jimenez Maria Enol | $240,000 |
Source: Public Records
Tax History Compared to Growth
Tax History
| Year | Tax Paid | Tax Assessment Tax Assessment Total Assessment is a certain percentage of the fair market value that is determined by local assessors to be the total taxable value of land and additions on the property. | Land | Improvement |
|---|---|---|---|---|
| 2025 | $9,043 | $104,000 | $63,600 | $40,400 |
| 2024 | $8,816 | $104,000 | $63,600 | $40,400 |
| 2023 | $8,816 | $104,000 | $63,600 | $40,400 |
| 2022 | $8,877 | $104,000 | $63,600 | $40,400 |
| 2021 | $8,824 | $104,000 | $63,600 | $40,400 |
| 2020 | $8,796 | $104,000 | $63,600 | $40,400 |
| 2019 | $8,684 | $104,000 | $63,600 | $40,400 |
| 2018 | $8,636 | $104,000 | $63,600 | $40,400 |
| 2017 | $8,590 | $104,000 | $63,600 | $40,400 |
| 2016 | $8,401 | $104,000 | $63,600 | $40,400 |
| 2015 | $8,400 | $104,000 | $63,600 | $40,400 |
| 2014 | $8,166 | $104,000 | $63,600 | $40,400 |
Source: Public Records
Map
Nearby Homes
- 457 W 4th Ave
- 443 Wheatsheaf Rd
- 463 W 6th Ave
- 323 Dermody St
- 219 Gordon St
- 37 Independence Dr
- 13 Independence Dr
- 38 Independence Dr
- 569 Berlant Ave
- 569 W 5th Ave
- 65 Independence Dr
- 624 Jackson Ave
- 339 W 3rd Ave
- 350 Birch Dr
- 540 W 7th Ave
- 54 Pallant Ave
- 53 Pallant Ave
- 107 Myrtle St
- 57 Berlant Ave
- 38 Pallant Ave