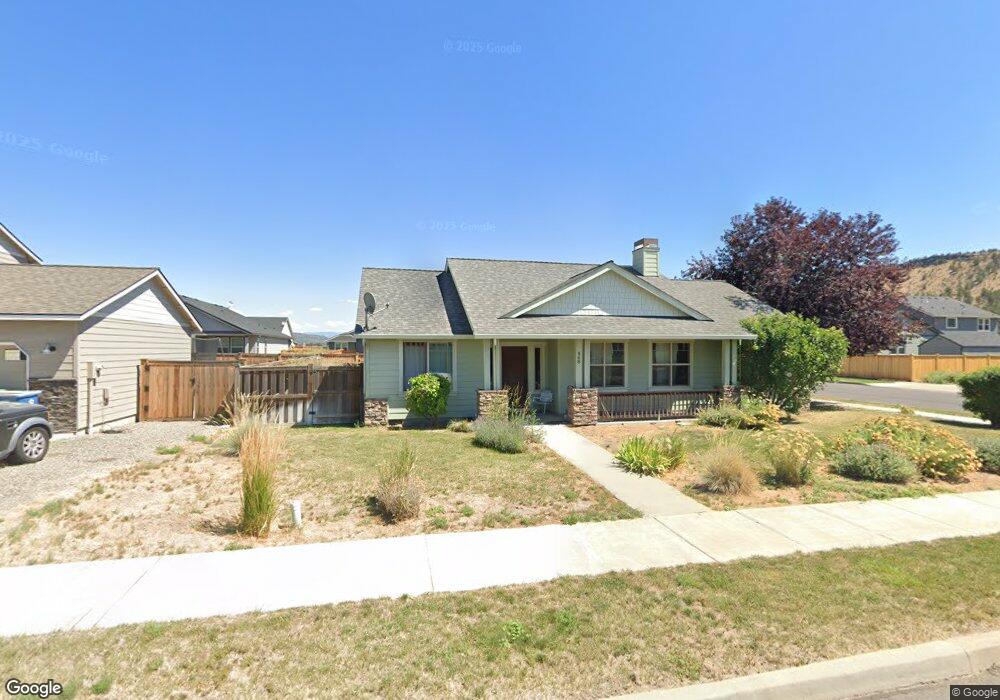
468 SE Sumner Dr Unit 69 Prineville, OR 97754
Estimated Value: $432,892 - $499,000
3
Beds
2
Baths
1,696
Sq Ft
$275/Sq Ft
Est. Value
About This Home
This home is located at 468 SE Sumner Dr Unit 69, Prineville, OR 97754 and is currently estimated at $465,946, approximately $274 per square foot. 468 SE Sumner Dr Unit 69 is a home with nearby schools including Crook County Middle School, Crook County High School, and Cascade Virtual Academy.
Ownership History
Date
Name
Owned For
Owner Type
Purchase Details
Closed on
Sep 23, 2025
Sold by
Pierce Gary D and Pierce Donald W
Bought by
Davis Alyssa Michelle and Stubblefield Zander Clay
Current Estimated Value
Home Financials for this Owner
Home Financials are based on the most recent Mortgage that was taken out on this home.
Original Mortgage
$422,211
Outstanding Balance
$422,211
Interest Rate
6.58%
Mortgage Type
FHA
Estimated Equity
$43,735
Purchase Details
Closed on
Jan 12, 2011
Sold by
Pierce Gary D
Bought by
Pierce Gary D and Pierce Donald W
Purchase Details
Closed on
Sep 2, 2010
Sold by
Pierce Donald W
Bought by
Pierce Gary D
Home Financials for this Owner
Home Financials are based on the most recent Mortgage that was taken out on this home.
Original Mortgage
$45,000
Interest Rate
4.48%
Mortgage Type
New Conventional
Purchase Details
Closed on
Mar 23, 2010
Sold by
Top Development Llc
Bought by
Pierce Gary D and Pierce Donald W
Create a Home Valuation Report for This Property
The Home Valuation Report is an in-depth analysis detailing your home's value as well as a comparison with similar homes in the area
Home Values in the Area
Average Home Value in this Area
Purchase History
| Date | Buyer | Sale Price | Title Company |
|---|---|---|---|
| Davis Alyssa Michelle | $430,000 | Western Title | |
| Pierce Gary D | -- | Accommodation | |
| Pierce Gary D | -- | Western Title & Escrow Co | |
| Pierce Gary D | $50,000 | Amerititle |
Source: Public Records
Mortgage History
| Date | Status | Borrower | Loan Amount |
|---|---|---|---|
| Open | Davis Alyssa Michelle | $422,211 | |
| Previous Owner | Pierce Gary D | $45,000 |
Source: Public Records
Tax History Compared to Growth
Tax History
| Year | Tax Paid | Tax Assessment Tax Assessment Total Assessment is a certain percentage of the fair market value that is determined by local assessors to be the total taxable value of land and additions on the property. | Land | Improvement |
|---|---|---|---|---|
| 2025 | $4,079 | $253,830 | -- | -- |
| 2024 | $3,974 | $246,440 | -- | -- |
| 2023 | $3,838 | $239,270 | $0 | $0 |
| 2022 | $3,719 | $232,310 | $0 | $0 |
| 2021 | $3,699 | $225,550 | $0 | $0 |
| 2020 | $3,597 | $218,984 | $0 | $0 |
| 2019 | $3,474 | $206,414 | $0 | $0 |
| 2018 | $3,382 | $206,414 | $0 | $0 |
| 2017 | $3,325 | $200,402 | $0 | $0 |
| 2016 | $3,180 | $188,898 | $0 | $0 |
| 2015 | $3,046 | $188,898 | $0 | $0 |
| 2013 | -- | $183,396 | $0 | $0 |
Source: Public Records
Map
Nearby Homes
- 2944 SE Triangle Outfit Dr
- 226 SE Willowdale Dr
- 1501 NE Laughlin Rd Unit 13
- 1501 NE Laughlin Rd Unit 16
- 1501 NE Laughlin Rd Unit 15
- 1501 NE Laughlin Rd Unit 20
- 1501 NE Laughlin Rd Unit 19
- 1501 NE Laughlin Rd Unit 14
- 905 NE Barnes Rd
- 3844 NE Butte Ln
- 900 SE Willowdale Dr
- 2241 SE Roadway Ln
- 2717 SE Hill St
- 2180 SE Melrose Dr
- 151605 NE 3rd St
- 0 SE Combs Flat Rd Unit 9 220209732
- 0 SE Combs Flat Rd Unit 3 220209725
- 0 SE Hill St Unit TL02400-11938
- 250 NE Saint Charles Way
- 1130 NE Barnes Rd
- 454 SE Sumner Dr Unit 68
- 454 SE Sumner Dr
- 453 SE Stetson Ct
- 485 SE Stetson Ct
- 3098 SE Triangle Outfit Dr Unit 51
- 467 SE Stetson Ct Unit 70
- 437 SE Stetson Ct
- 447 SE Stetson Ct Unit Lot 71
- 499 SE Stetson Ct
- 465 SE Sumner Dr
- 428 SE Sumner Dr Unit 67
- 428 SE Sumner Dr
- 491 SE Stetson Ct Unit 96
- 421 SE Stetson Ct
- 463 SE Sumner Dr Unit 52
- 463 SE Sumner Dr
- 429 SE Stetson Ct Unit 72
- 445 SE Sumner Dr Unit 53
- 445 SE Sumner Dr
- 3080 SE Triangle Outfit Dr Unit 50