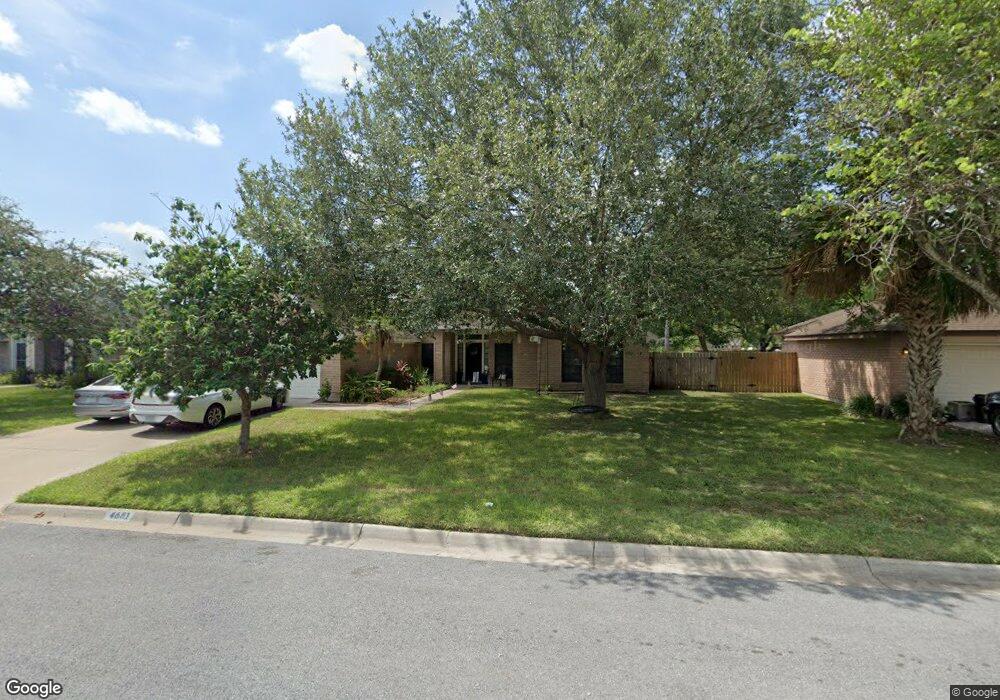
4681 Beaver Pond Dr Brownsville, TX 78520
Estimated Value: $275,000 - $303,000
3
Beds
2
Baths
1,740
Sq Ft
$166/Sq Ft
Est. Value
About This Home
This home is located at 4681 Beaver Pond Dr, Brownsville, TX 78520 and is currently estimated at $289,366, approximately $166 per square foot. 4681 Beaver Pond Dr is a home located in Cameron County with nearby schools including Yturria Elementary School, Stillman Middle School, and Veterans Memorial Early College High School.
Ownership History
Date
Name
Owned For
Owner Type
Purchase Details
Closed on
Dec 8, 2014
Sold by
Riebeling Alejandro and Reibeling Claudia Sereni De
Bought by
Arellano Juan G and Arellano Frida
Current Estimated Value
Home Financials for this Owner
Home Financials are based on the most recent Mortgage that was taken out on this home.
Original Mortgage
$145,000
Outstanding Balance
$111,355
Interest Rate
3.99%
Estimated Equity
$178,011
Purchase Details
Closed on
Nov 14, 2000
Sold by
Jahner Tony and Jahner Rochelle
Bought by
Riebeling Alejandro and Deriebeling Claudia Sereni
Purchase Details
Closed on
Jan 5, 1998
Sold by
Estopinal Richard Louis and Estopinal Susan L
Bought by
Jahner Tony and Jahner Rochelle
Home Financials for this Owner
Home Financials are based on the most recent Mortgage that was taken out on this home.
Original Mortgage
$114,950
Interest Rate
7.14%
Create a Home Valuation Report for This Property
The Home Valuation Report is an in-depth analysis detailing your home's value as well as a comparison with similar homes in the area
Home Values in the Area
Average Home Value in this Area
Purchase History
| Date | Buyer | Sale Price | Title Company |
|---|---|---|---|
| Arellano Juan G | -- | Rio Grande Valley Abstract C | |
| Riebeling Alejandro | -- | -- | |
| Jahner Tony | -- | -- |
Source: Public Records
Mortgage History
| Date | Status | Borrower | Loan Amount |
|---|---|---|---|
| Open | Arellano Juan G | $145,000 | |
| Previous Owner | Jahner Tony | $114,950 |
Source: Public Records
Tax History Compared to Growth
Tax History
| Year | Tax Paid | Tax Assessment Tax Assessment Total Assessment is a certain percentage of the fair market value that is determined by local assessors to be the total taxable value of land and additions on the property. | Land | Improvement |
|---|---|---|---|---|
| 2025 | $3,571 | $222,408 | -- | -- |
| 2024 | $3,571 | $202,189 | -- | -- |
| 2023 | $4,217 | $183,808 | $0 | $0 |
| 2022 | $4,334 | $167,098 | $46,000 | $121,098 |
| 2021 | $4,283 | $168,606 | $46,000 | $122,606 |
| 2020 | $3,923 | $150,622 | $25,000 | $125,622 |
| 2019 | $3,849 | $144,518 | $25,000 | $119,518 |
| 2018 | $3,798 | $143,000 | $25,000 | $118,000 |
| 2017 | $3,659 | $144,378 | $25,000 | $119,378 |
| 2016 | $3,729 | $147,135 | $25,000 | $122,135 |
| 2015 | $2,997 | $148,515 | $25,000 | $123,515 |
Source: Public Records
Map
Nearby Homes
- 4823 Lakeway Dr
- 3096 W Lake Ave Unit 7,20
- 4045 Lake View Dr
- 3515 Heritage Cir Unit LOT 10 & 11
- 1708 Deep Spring St
- 2500 Windsor Place
- 1974 Royal Oak St
- 2400 Firenze St
- 1809 Royal Oak St
- 1920 Royal Oak St
- 2822 W Alton Gloor Blvd
- N/A Stream Ct
- 2764 Cairo St
- 2720 Mayorca St
- 5590 Vidos Dr
- 2848 Riviera St
- 3516 Hidalgo Cir Unit LOT 1 BLK 4
- 3604 Hidalgo Cir Unit LOT 1 BLK 6
- TBD Beach Dunes Lot 21
- 0 W Alton Gloor Blvd
- 4691 Beaver Pond Dr
- 4671 Beaver Pond Dr
- 1313 Pepper Tree Cir
- 4714 Lakeway Dr
- 4701 Beaver Pond Dr
- 4652 Beaver Pond Dr
- 1323 Pepper Tree Cir
- 4662 Beaver Pond Dr
- 4724 Lakeway Dr
- 4724 Lakeway Dr Unit 44
- 4642 Beaver Pond Dr
- 4672 Beaver Pond Dr
- 4682 Lakeway Dr
- 4711 Beaver Pond Dr
- 4734 Lakeway Dr
- 1284 Cedar Ridge Dr
- 1274 Cedar Ridge Dr
- 1333 Pepper Tree Cir
- 4682 Beaver Pond Dr
- 1294 Cedar Ridge Dr