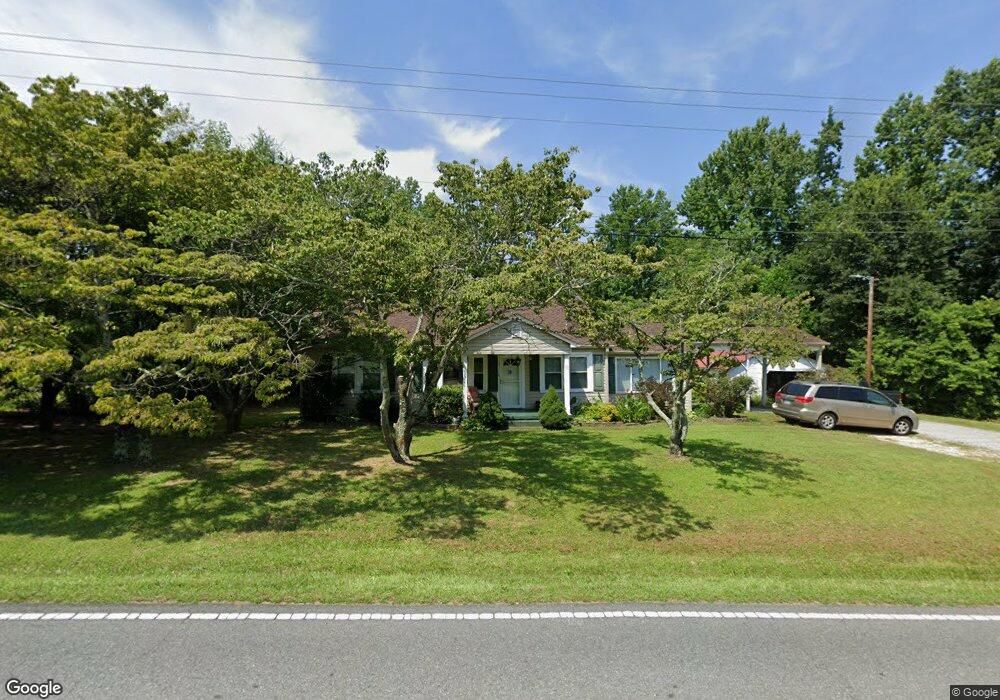
4681 Rainbow Dr Kannapolis, NC 28081
Estimated Value: $219,000 - $253,836
3
Beds
1
Bath
1,340
Sq Ft
$174/Sq Ft
Est. Value
About This Home
This home is located at 4681 Rainbow Dr, Kannapolis, NC 28081 and is currently estimated at $233,459, approximately $174 per square foot. 4681 Rainbow Dr is a home located in Cabarrus County with nearby schools including Fred L. Wilson Elementary School, Kannapolis Middle, and A.L. Brown High School.
Ownership History
Date
Name
Owned For
Owner Type
Purchase Details
Closed on
Jul 16, 2015
Sold by
Jones Mark Everette and Jones Stephanie Privette
Bought by
Causey Logan C and Causey Lindsay N
Current Estimated Value
Home Financials for this Owner
Home Financials are based on the most recent Mortgage that was taken out on this home.
Original Mortgage
$88,369
Outstanding Balance
$69,830
Interest Rate
4.25%
Mortgage Type
FHA
Estimated Equity
$163,629
Purchase Details
Closed on
Dec 28, 2006
Sold by
Jones Mark Everette
Bought by
Jones Mark Everette and Jones Stephanie Privette
Home Financials for this Owner
Home Financials are based on the most recent Mortgage that was taken out on this home.
Original Mortgage
$98,000
Interest Rate
5.86%
Mortgage Type
New Conventional
Purchase Details
Closed on
May 31, 2002
Sold by
Jones Patricia C
Bought by
Jones Mark Everette
Home Financials for this Owner
Home Financials are based on the most recent Mortgage that was taken out on this home.
Original Mortgage
$43,600
Interest Rate
6.92%
Create a Home Valuation Report for This Property
The Home Valuation Report is an in-depth analysis detailing your home's value as well as a comparison with similar homes in the area
Home Values in the Area
Average Home Value in this Area
Purchase History
| Date | Buyer | Sale Price | Title Company |
|---|---|---|---|
| Causey Logan C | $90,000 | None Available | |
| Jones Mark Everette | -- | None Available | |
| Jones Mark Everette | $45,000 | -- |
Source: Public Records
Mortgage History
| Date | Status | Borrower | Loan Amount |
|---|---|---|---|
| Open | Causey Logan C | $88,369 | |
| Previous Owner | Jones Mark Everette | $98,000 | |
| Previous Owner | Jones Mark Everette | $43,600 |
Source: Public Records
Tax History
| Year | Tax Paid | Tax Assessment Tax Assessment Total Assessment is a certain percentage of the fair market value that is determined by local assessors to be the total taxable value of land and additions on the property. | Land | Improvement |
|---|---|---|---|---|
| 2025 | $1,293 | $191,340 | $57,000 | $134,340 |
| 2024 | $1,293 | $191,340 | $57,000 | $134,340 |
| 2023 | $981 | $116,810 | $37,050 | $79,760 |
| 2022 | $981 | $116,810 | $37,050 | $79,760 |
| 2021 | $981 | $116,810 | $37,050 | $79,760 |
| 2020 | $945 | $112,540 | $37,050 | $75,490 |
| 2019 | $717 | $85,390 | $19,500 | $65,890 |
| 2018 | $700 | $85,390 | $19,500 | $65,890 |
| 2017 | $666 | $85,390 | $19,500 | $65,890 |
| 2016 | $628 | $84,710 | $22,500 | $62,210 |
| 2015 | $583 | $84,710 | $22,500 | $62,210 |
| 2014 | $583 | $84,710 | $22,500 | $62,210 |
Source: Public Records
Map
Nearby Homes
- 1734 Shadowbrook Dr
- 0000 Buffalo St
- TBD Dnu
- 1530 Buffalo St
- 6124 Avalon Dr
- 1711 W C St
- 1526 Buffalo St
- 1809 W C St
- 1814 W C St
- 113 Hilton Ave
- 115 Arlene Ave
- 1408 Westwinds Ct
- 5010 Athens St
- 0 W C St Unit 2 CAR4255761
- 0 W C St Unit CAR4255556
- 500 Echo Ave
- 103 Westover Ave
- 1405 Birch St
- 1402 Birch St
- 5875 Granbury Dr
- 4687 Rainbow Dr
- 4671 Rainbow Dr
- 4686 Rainbow Dr
- 1716 Rainbow Dr
- 4682 Rainbow Dr
- 4699 Rainbow Dr
- 4637 Rainbow Dr
- 4690 Rainbow Dr
- 1932 Normandy Rd
- 1934 Normandy Rd
- 1930 Normandy Rd
- 2000 Normandy Rd
- 0 Normandy Rd
- 2002 Normandy Rd
- 4707 Rainbow Dr
- 4645 Rainbow Dr
- 2019 Rollingwood Dr
- 4702 Rainbow Dr
- 4646 Rainbow Dr
- 2015 Rollingwood Dr
Your Personal Tour Guide
Ask me questions while you tour the home.