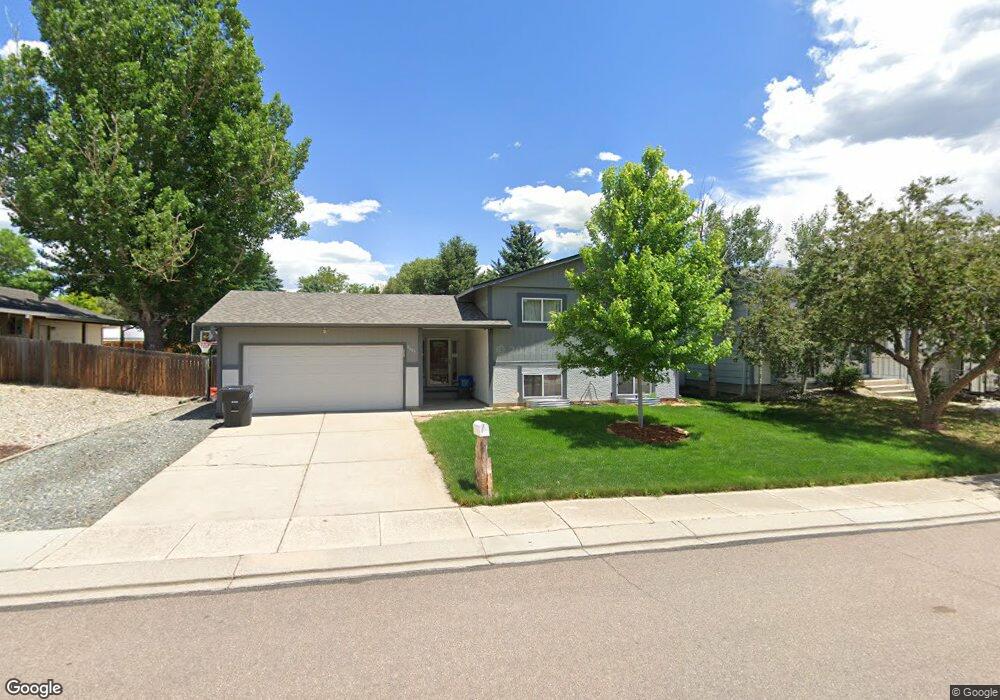
4685 Bunchberry Ln Colorado Springs, CO 80917
Old Farms NeighborhoodEstimated Value: $389,834 - $428,000
4
Beds
2
Baths
997
Sq Ft
$411/Sq Ft
Est. Value
About This Home
This home is located at 4685 Bunchberry Ln, Colorado Springs, CO 80917 and is currently estimated at $409,709, approximately $410 per square foot. 4685 Bunchberry Ln is a home located in El Paso County with nearby schools including Rudy Elementary School, Sabin Middle School, and Doherty High School.
Ownership History
Date
Name
Owned For
Owner Type
Purchase Details
Closed on
Mar 31, 2006
Sold by
Gonsalves Brian A and Drader Gonsalves Dorreen Y
Bought by
Bier Richard L
Current Estimated Value
Home Financials for this Owner
Home Financials are based on the most recent Mortgage that was taken out on this home.
Original Mortgage
$189,525
Outstanding Balance
$108,157
Interest Rate
6.24%
Mortgage Type
FHA
Estimated Equity
$301,552
Purchase Details
Closed on
Jun 28, 2002
Sold by
Rupe Susan D
Bought by
Gonsalves Brian A and Drader Gonsalves Dorreen Y
Home Financials for this Owner
Home Financials are based on the most recent Mortgage that was taken out on this home.
Original Mortgage
$161,466
Interest Rate
6.78%
Purchase Details
Closed on
Feb 25, 1999
Sold by
Rupe Charles L
Bought by
Rupe Susan D
Purchase Details
Closed on
Jun 14, 1988
Bought by
Bier Richard L
Create a Home Valuation Report for This Property
The Home Valuation Report is an in-depth analysis detailing your home's value as well as a comparison with similar homes in the area
Home Values in the Area
Average Home Value in this Area
Purchase History
| Date | Buyer | Sale Price | Title Company |
|---|---|---|---|
| Bier Richard L | $192,500 | Land Title Guarantee Company | |
| Gonsalves Brian A | $164,000 | Security Title | |
| Rupe Susan D | -- | -- | |
| Bier Richard L | -- | -- |
Source: Public Records
Mortgage History
| Date | Status | Borrower | Loan Amount |
|---|---|---|---|
| Open | Bier Richard L | $189,525 | |
| Previous Owner | Gonsalves Brian A | $161,466 |
Source: Public Records
Tax History Compared to Growth
Tax History
| Year | Tax Paid | Tax Assessment Tax Assessment Total Assessment is a certain percentage of the fair market value that is determined by local assessors to be the total taxable value of land and additions on the property. | Land | Improvement |
|---|---|---|---|---|
| 2025 | $1,329 | $28,770 | -- | -- |
| 2024 | $1,216 | $28,330 | $4,400 | $23,930 |
| 2023 | $1,216 | $28,330 | $4,400 | $23,930 |
| 2022 | $1,161 | $20,750 | $3,340 | $17,410 |
| 2021 | $1,259 | $21,340 | $3,430 | $17,910 |
| 2020 | $1,296 | $19,100 | $2,970 | $16,130 |
| 2019 | $1,289 | $19,100 | $2,970 | $16,130 |
| 2018 | $1,209 | $16,480 | $2,590 | $13,890 |
| 2017 | $1,145 | $16,480 | $2,590 | $13,890 |
| 2016 | $878 | $15,150 | $2,170 | $12,980 |
| 2015 | $875 | $15,150 | $2,170 | $12,980 |
| 2014 | $821 | $13,650 | $2,170 | $11,480 |
Source: Public Records
Map
Nearby Homes
- 4955 Chickweed Dr
- 4774 Bunchberry Ln
- 4636 Winewood Village Dr
- 4652 Excalibur Ct
- 4671 Winewood Village Dr Unit X4671
- 4534 Winewood Village Dr Unit P4534
- 4878 S Old Brook Cir
- 5002 Barnes Rd
- 4501 Winewood Village Dr Unit K4501
- 4685 Barnes Rd
- 5117 Solar Ridge Dr
- 4842 S Old Brook Cir
- 4768 S Gracemoor Cir
- 4735 Iron Horse Villas Point
- 4835 W Old Farm Cir
- 4317 Sammers View
- 4958 Wood Brook Ct
- 4504 Bell Flower Dr
- 5210 Coneflower Ln
- 5102 Rainbow Harbour Cir
- 4675 Bunchberry Ln
- 4835 Chickweed Dr
- 4695 Bunchberry Ln
- 4680 Bluestem Ln
- 4665 Bunchberry Ln
- 4670 Bluestem Ln
- 4690 Bluestem Ln
- 4680 Bunchberry Ln
- 4670 Bunchberry Ln
- 4655 Bunchberry Ln
- 4660 Bluestem Ln
- 4660 Bunchberry Ln
- 4690 Bunchberry Ln
- 4830 Chickweed Dr
- 4840 Chickweed Dr
- 4645 Bunchberry Ln
- 4710 Bunchberry Ln
- 4650 Bluestem Ln
- 4850 Chickweed Dr
- 4685 Bluestem Ln