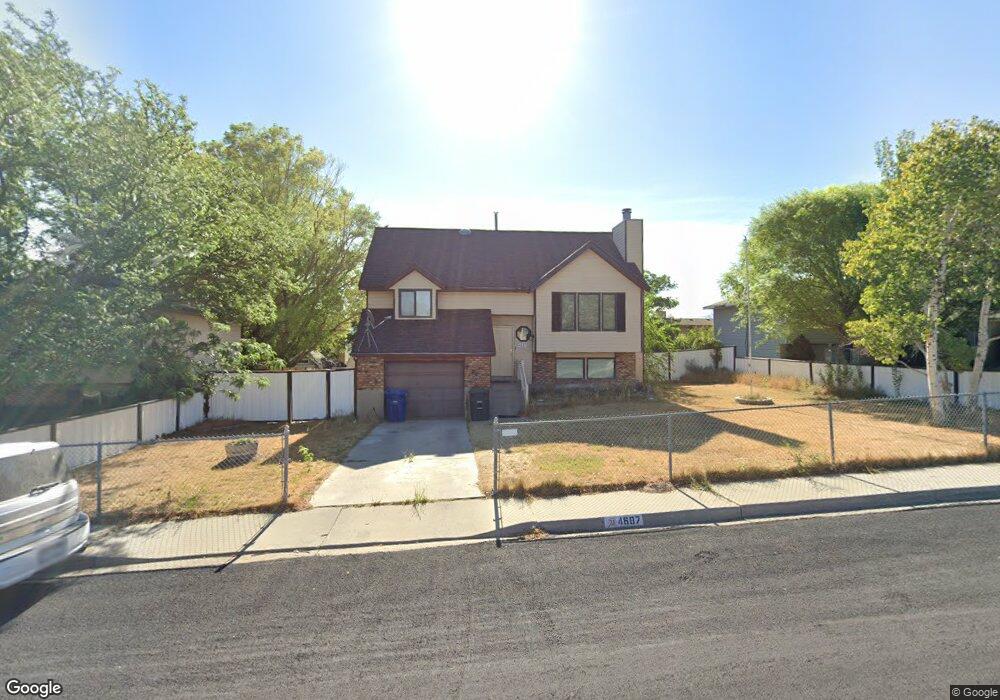
4687 Inca Cir Salt Lake City, UT 84120
Hunter NeighborhoodEstimated Value: $435,000 - $479,000
3
Beds
2
Baths
1,670
Sq Ft
$275/Sq Ft
Est. Value
About This Home
This home is located at 4687 Inca Cir, Salt Lake City, UT 84120 and is currently estimated at $458,468, approximately $274 per square foot. 4687 Inca Cir is a home located in Salt Lake County with nearby schools including Kennedy Junior High School, Hunter High School, and Ascent Academies Of Utah - West Valley.
Ownership History
Date
Name
Owned For
Owner Type
Purchase Details
Closed on
Dec 15, 2023
Sold by
George R Taylor Family Trust
Bought by
Bowles Tyler
Current Estimated Value
Home Financials for this Owner
Home Financials are based on the most recent Mortgage that was taken out on this home.
Original Mortgage
$400,500
Outstanding Balance
$394,177
Interest Rate
7.76%
Mortgage Type
New Conventional
Estimated Equity
$64,291
Purchase Details
Closed on
Aug 15, 2012
Sold by
Taylor George R
Bought by
Taylor George R and George R Taylor Family Trust
Purchase Details
Closed on
Jul 29, 1994
Sold by
Nielsen Sterling W and Nielsen Stephanie C
Bought by
Taylor George R and Taylor Georgia Lee
Home Financials for this Owner
Home Financials are based on the most recent Mortgage that was taken out on this home.
Original Mortgage
$89,900
Interest Rate
8.5%
Mortgage Type
VA
Create a Home Valuation Report for This Property
The Home Valuation Report is an in-depth analysis detailing your home's value as well as a comparison with similar homes in the area
Home Values in the Area
Average Home Value in this Area
Purchase History
| Date | Buyer | Sale Price | Title Company |
|---|---|---|---|
| Bowles Tyler | -- | Sutherland Title Company | |
| Taylor George R | -- | None Available | |
| Taylor George R | -- | -- |
Source: Public Records
Mortgage History
| Date | Status | Borrower | Loan Amount |
|---|---|---|---|
| Open | Bowles Tyler | $400,500 | |
| Previous Owner | Taylor George R | $89,900 |
Source: Public Records
Tax History Compared to Growth
Tax History
| Year | Tax Paid | Tax Assessment Tax Assessment Total Assessment is a certain percentage of the fair market value that is determined by local assessors to be the total taxable value of land and additions on the property. | Land | Improvement |
|---|---|---|---|---|
| 2025 | $2,745 | $436,700 | $125,400 | $311,300 |
| 2024 | $2,745 | $419,000 | $120,300 | $298,700 |
| 2023 | $384 | $355,400 | $106,800 | $248,600 |
| 2022 | $384 | $366,000 | $104,800 | $261,200 |
| 2021 | $2,779 | $283,700 | $80,600 | $203,100 |
| 2020 | $1,978 | $245,800 | $74,700 | $171,100 |
| 2019 | $1,997 | $239,400 | $70,400 | $169,000 |
| 2018 | $0 | $215,700 | $70,400 | $145,300 |
| 2017 | $0 | $200,600 | $70,400 | $130,200 |
| 2016 | -- | $187,500 | $70,400 | $117,100 |
| 2015 | -- | $162,900 | $71,600 | $91,300 |
| 2014 | -- | $156,400 | $69,300 | $87,100 |
Source: Public Records
Map
Nearby Homes
- 4865 S Townsend Way
- 4902 S Farah Dr
- 4521 S Tarlton Cir
- 4582 Early Duke St
- 4924 S 5455 W
- 5075 W 4700 S
- 5075 W 4700 S Unit 76
- 5075 W 4700 S Unit 66
- 5075 W 4700 S Unit 172
- 5075 W 4700 S Unit 89
- 5075 W 4700 S Unit 114
- 5269 W Cherrywood Ln
- 4452 S Red Cherry Cir
- 5109 W Wildrose Dr
- 4894 W Westpoint Dr
- 4989 W Cherrywood Ln
- 4597 S Trojan Dr
- 5050 W Lotus Blossom Dr
- 5644 W 4360 S
- 5950 W 4700 S
- 4695 Inca Cir
- 4682 Solano Cir
- 4692 Solano Cir
- 4692 S Solano Cir
- 4672 Solano Cir
- 4672 S Solano Cir
- 4686 Inca Cir
- 4667 Inca Cir
- 4667 S Inca Cir
- 4694 Inca Cir
- 4676 Inca Cir
- 4664 Solano Cir
- 4666 Inca Cir
- 4666 S Inca Cir
- 4659 Inca Cir
- 4683 S 5400 W
- 4683 S Solano Cir
- 4683 Solano Cir
- 4654 Solano Cir
- 4691 S 5400 W