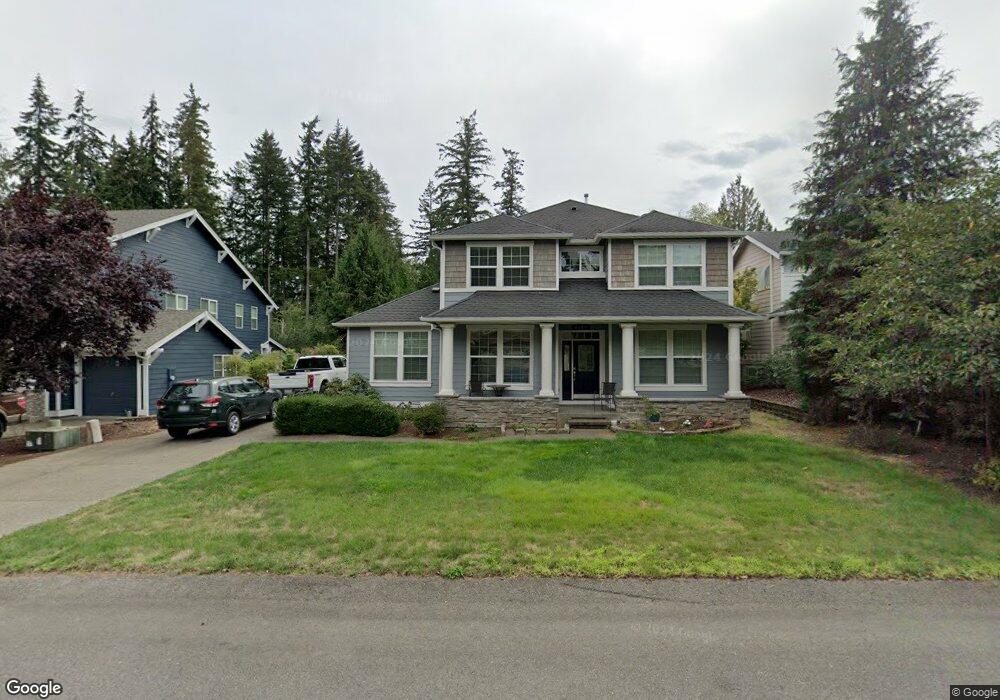
4687 Rutherford Cir SW Port Orchard, WA 98367
McCormick Woods NeighborhoodEstimated Value: $706,609 - $852,000
4
Beds
3
Baths
2,648
Sq Ft
$296/Sq Ft
Est. Value
About This Home
This home is located at 4687 Rutherford Cir SW, Port Orchard, WA 98367 and is currently estimated at $783,652, approximately $295 per square foot. 4687 Rutherford Cir SW is a home located in Kitsap County with nearby schools including Sunnyslope Elementary School, Cedar Heights Middle School, and South Kitsap High School.
Ownership History
Date
Name
Owned For
Owner Type
Purchase Details
Closed on
Jul 18, 2018
Sold by
Weeks Arlinda
Bought by
Weeks Jeffrey
Current Estimated Value
Purchase Details
Closed on
Nov 16, 2007
Sold by
Sshi Llc
Bought by
Weeks Jeffrey D and Weeks Arlinda K
Home Financials for this Owner
Home Financials are based on the most recent Mortgage that was taken out on this home.
Original Mortgage
$467,092
Outstanding Balance
$295,228
Interest Rate
6.36%
Mortgage Type
VA
Estimated Equity
$488,424
Create a Home Valuation Report for This Property
The Home Valuation Report is an in-depth analysis detailing your home's value as well as a comparison with similar homes in the area
Home Values in the Area
Average Home Value in this Area
Purchase History
| Date | Buyer | Sale Price | Title Company |
|---|---|---|---|
| Weeks Jeffrey | -- | None Available | |
| Weeks Jeffrey D | $484,692 | First American Title Ins Co |
Source: Public Records
Mortgage History
| Date | Status | Borrower | Loan Amount |
|---|---|---|---|
| Open | Weeks Jeffrey D | $467,092 |
Source: Public Records
Tax History Compared to Growth
Tax History
| Year | Tax Paid | Tax Assessment Tax Assessment Total Assessment is a certain percentage of the fair market value that is determined by local assessors to be the total taxable value of land and additions on the property. | Land | Improvement |
|---|---|---|---|---|
| 2026 | $5,540 | $605,480 | $129,150 | $476,330 |
| 2025 | $5,540 | $634,940 | $129,150 | $505,790 |
| 2024 | $5,347 | $634,940 | $129,150 | $505,790 |
| 2023 | $4,979 | $591,680 | $129,150 | $462,530 |
| 2022 | $5,034 | $503,600 | $117,600 | $386,000 |
| 2021 | $4,941 | $468,580 | $109,200 | $359,380 |
| 2020 | $4,905 | $451,070 | $105,000 | $346,070 |
| 2019 | $4,126 | $415,390 | $101,940 | $313,450 |
| 2018 | $4,538 | $321,950 | $78,530 | $243,420 |
| 2017 | $3,527 | $321,950 | $78,530 | $243,420 |
| 2016 | $3,581 | $302,640 | $73,400 | $229,240 |
| 2015 | $3,304 | $283,740 | $73,400 | $210,340 |
| 2014 | -- | $279,010 | $73,400 | $205,610 |
| 2013 | -- | $303,060 | $83,410 | $219,650 |
Source: Public Records
Map
Nearby Homes
- 4710 Rutherford Cir SW
- 4715 Olivine Dr SW
- 4510 Castleton Rd SW
- 4460 Castleton Rd SW
- 4821 Amherst Way SW
- 3850 Portside Dr
- 4930 Castleton Rd SW
- 2430 Puget Sound Blvd
- 3956 McCormick Village Dr
- 4281 Wandering Way
- 0 Lot 2 McCormick Village Dr
- 4171 Wandering Way
- 1566 SW Old Clifton Rd
- 4131 Wandering Way
- 3978 McCormick Village Dr
- 3974 McCormick Village Dr
- 4111 Wandering Way
- 3970 McCormick Village Dr
- 4101 Wandering Way
- 3966 McCormick Village Dr
- 4693 Rutherford Cir SW
- 4681 Rutherford Cir SW
- 4675 Rutherford Cir SW
- 4686 Rutherford Cir SW
- 4692 Rutherford Cir SW
- 4680 Rutherford Cir SW
- 4669 Rutherford Cir SW
- 4705 Rutherford Cir SW
- 4698 Rutherford Cir SW
- 4771 Rutherford Cir SW
- 4777 Rutherford Cir SW
- 4765 Rutherford Cir SW
- 4704 Rutherford Cir SW
- 4759 Rutherford Cir SW
- 4603 Rutherford Cir SW
- 4591 Rutherford Cir SW
- 4585 Rutherford Cir SW
- 4662 Berwick Place SW
- 4716 Rutherford Cir SW