Estimated Value: $349,000 - $381,000
3
Beds
1
Bath
2,150
Sq Ft
$171/Sq Ft
Est. Value
About This Home
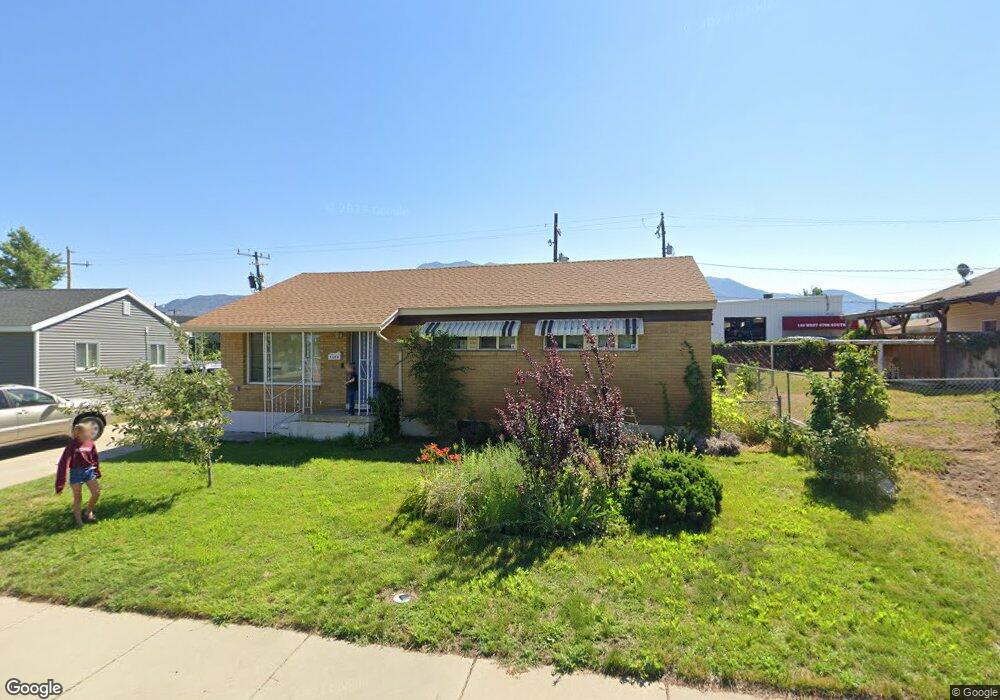
This home is located at 4688 S 175 W, Ogden, UT 84405 and is currently estimated at $367,853, approximately $171 per square foot. 4688 S 175 W is a home located in Weber County with nearby schools including Washington Terrace School, T.H. Bell Junior High School, and Bonneville High School.
Ownership History
Date
Name
Owned For
Owner Type
Purchase Details
Closed on
Nov 7, 2019
Sold by
Rhoades Alex C and Rhoades Bethany A
Bought by
Darley Scott Michael
Current Estimated Value
Home Financials for this Owner
Home Financials are based on the most recent Mortgage that was taken out on this home.
Original Mortgage
$225,000
Outstanding Balance
$197,942
Interest Rate
3.6%
Mortgage Type
VA
Estimated Equity
$169,911
Purchase Details
Closed on
Oct 11, 2005
Sold by
Christensen John H
Bought by
Olpin Adam Glen and Olpin Stephanie
Home Financials for this Owner
Home Financials are based on the most recent Mortgage that was taken out on this home.
Original Mortgage
$112,238
Interest Rate
5.63%
Mortgage Type
FHA
Purchase Details
Closed on
Apr 20, 1998
Sold by
Christensen Lohn H and Christensen Anna Victoria
Bought by
Christensen John H
Home Financials for this Owner
Home Financials are based on the most recent Mortgage that was taken out on this home.
Original Mortgage
$78,200
Interest Rate
9.85%
Create a Home Valuation Report for This Property
The Home Valuation Report is an in-depth analysis detailing your home's value as well as a comparison with similar homes in the area
Home Values in the Area
Average Home Value in this Area
Purchase History
| Date | Buyer | Sale Price | Title Company |
|---|---|---|---|
| Darley Scott Michael | -- | Stewart Title Ins Agcy Of | |
| Olpin Adam Glen | -- | First American Title | |
| Olpin Adam Glen | -- | -- | |
| Christensen John H | -- | Associated Title |
Source: Public Records
Mortgage History
| Date | Status | Borrower | Loan Amount |
|---|---|---|---|
| Open | Darley Scott Michael | $225,000 | |
| Previous Owner | Olpin Adam Glen | $112,238 | |
| Previous Owner | Christensen John H | $78,200 |
Source: Public Records
Tax History Compared to Growth
Tax History
| Year | Tax Paid | Tax Assessment Tax Assessment Total Assessment is a certain percentage of the fair market value that is determined by local assessors to be the total taxable value of land and additions on the property. | Land | Improvement |
|---|---|---|---|---|
| 2025 | $333 | $357,819 | $112,390 | $245,429 |
| 2024 | $333 | $190,849 | $61,814 | $129,035 |
| 2023 | $2,234 | $184,250 | $61,251 | $122,999 |
| 2022 | $278 | $204,050 | $58,559 | $145,491 |
| 2021 | $272 | $256,000 | $56,191 | $199,809 |
| 2020 | $1,843 | $234,000 | $46,049 | $187,951 |
| 2019 | $1,753 | $205,000 | $46,049 | $158,951 |
| 2018 | $1,514 | $171,000 | $46,049 | $124,951 |
| 2017 | $1,389 | $145,000 | $30,922 | $114,078 |
| 2016 | $1,250 | $70,207 | $16,871 | $53,336 |
| 2015 | $1,258 | $69,567 | $16,871 | $52,696 |
| 2014 | $1,163 | $62,869 | $16,871 | $45,998 |
Source: Public Records
Map
Nearby Homes