Estimated Value: $370,000 - $388,000
4
Beds
2
Baths
1,868
Sq Ft
$204/Sq Ft
Est. Value
About This Home
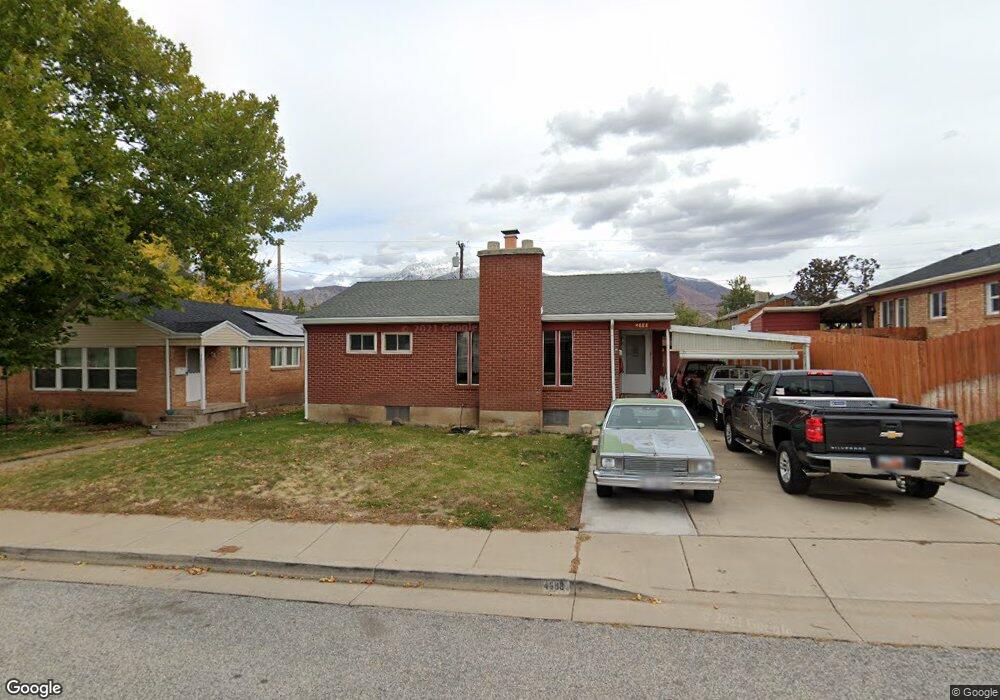
This home is located at 4688 S 275 W, Ogden, UT 84405 and is currently estimated at $380,237, approximately $203 per square foot. 4688 S 275 W is a home located in Weber County with nearby schools including Washington Terrace School, T.H. Bell Junior High School, and Bonneville High School.
Ownership History
Date
Name
Owned For
Owner Type
Purchase Details
Closed on
Mar 15, 2021
Sold by
Stark Jonathan
Bought by
Stark Jonathan and Stoddard Marisa
Current Estimated Value
Home Financials for this Owner
Home Financials are based on the most recent Mortgage that was taken out on this home.
Original Mortgage
$170,000
Outstanding Balance
$126,007
Interest Rate
2.7%
Mortgage Type
New Conventional
Estimated Equity
$254,230
Purchase Details
Closed on
Feb 28, 2012
Sold by
Hellstrom Rue J and Hellstrom Terry L
Bought by
Stark Janathan
Home Financials for this Owner
Home Financials are based on the most recent Mortgage that was taken out on this home.
Original Mortgage
$109,574
Interest Rate
3.87%
Mortgage Type
FHA
Purchase Details
Closed on
May 17, 2007
Sold by
Hellstrom Del Mar E and Hellstrom Leora J
Bought by
Hellstrom Del Mar E and Hellstrom Leora J
Create a Home Valuation Report for This Property
The Home Valuation Report is an in-depth analysis detailing your home's value as well as a comparison with similar homes in the area
Home Values in the Area
Average Home Value in this Area
Purchase History
| Date | Buyer | Sale Price | Title Company |
|---|---|---|---|
| Stark Jonathan | -- | First American Title | |
| Stark Janathan | -- | Inwest Title Services Inc | |
| Hellstrom Del Mar E | -- | None Available |
Source: Public Records
Mortgage History
| Date | Status | Borrower | Loan Amount |
|---|---|---|---|
| Open | Stark Jonathan | $170,000 | |
| Closed | Stark Janathan | $109,574 |
Source: Public Records
Tax History Compared to Growth
Tax History
| Year | Tax Paid | Tax Assessment Tax Assessment Total Assessment is a certain percentage of the fair market value that is determined by local assessors to be the total taxable value of land and additions on the property. | Land | Improvement |
|---|---|---|---|---|
| 2025 | $2,349 | $365,367 | $107,501 | $257,866 |
| 2024 | $2,349 | $194,699 | $59,125 | $135,574 |
| 2023 | $2,272 | $188,100 | $59,557 | $128,543 |
| 2022 | $2,361 | $203,500 | $56,893 | $146,607 |
| 2021 | $1,830 | $253,000 | $53,731 | $199,269 |
| 2020 | $1,834 | $233,000 | $44,011 | $188,989 |
| 2019 | $1,744 | $204,000 | $44,011 | $159,989 |
| 2018 | $1,519 | $172,000 | $44,011 | $127,989 |
| 2017 | $1,394 | $146,000 | $29,020 | $116,980 |
| 2016 | $1,266 | $71,570 | $16,232 | $55,338 |
| 2015 | $1,182 | $64,502 | $16,232 | $48,270 |
| 2014 | $1,182 | $64,292 | $16,232 | $48,060 |
Source: Public Records
Map
Nearby Homes