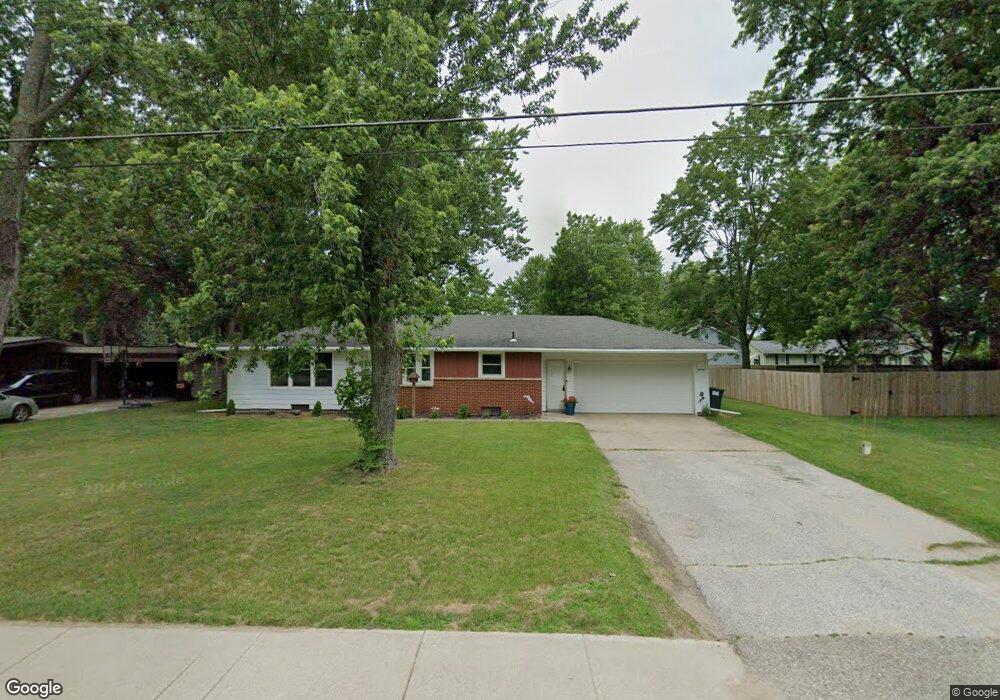
4689 South St Hamilton, MI 49419
Estimated Value: $251,191 - $293,000
3
Beds
1
Bath
1,130
Sq Ft
$238/Sq Ft
Est. Value
About This Home
This home is located at 4689 South St, Hamilton, MI 49419 and is currently estimated at $269,048, approximately $238 per square foot. 4689 South St is a home located in Allegan County with nearby schools including Hamilton High School.
Ownership History
Date
Name
Owned For
Owner Type
Purchase Details
Closed on
Sep 17, 2021
Sold by
Vandenbeldt James and Vandenbeldt Tracy
Bought by
Jr Property Solutions Llc
Current Estimated Value
Home Financials for this Owner
Home Financials are based on the most recent Mortgage that was taken out on this home.
Original Mortgage
$40,000
Outstanding Balance
$36,343
Interest Rate
2.7%
Mortgage Type
Commercial
Estimated Equity
$232,705
Purchase Details
Closed on
Mar 22, 2021
Sold by
Gates Stanley
Bought by
Vandenbeldt James and Vandenbeldt Tracy
Purchase Details
Closed on
Apr 28, 2011
Sold by
Gates Stanley G
Bought by
Three Gates Rentals Llc
Purchase Details
Closed on
Sep 9, 2009
Sold by
Gates Stanley G and Boeve Gates Ardella
Bought by
Stanley G Gates Trust
Purchase Details
Closed on
Jul 28, 2003
Sold by
The Ella Essink Trust
Bought by
Gates Stanley
Create a Home Valuation Report for This Property
The Home Valuation Report is an in-depth analysis detailing your home's value as well as a comparison with similar homes in the area
Home Values in the Area
Average Home Value in this Area
Purchase History
| Date | Buyer | Sale Price | Title Company |
|---|---|---|---|
| Jr Property Solutions Llc | -- | None Available | |
| Vandenbeldt James | -- | None Available | |
| Gates Stanley | -- | None Available | |
| Three Gates Rentals Llc | -- | None Available | |
| Stanley G Gates Trust | -- | None Available | |
| Gates Stanley | $115,000 | Chicago Title |
Source: Public Records
Mortgage History
| Date | Status | Borrower | Loan Amount |
|---|---|---|---|
| Open | Jr Property Solutions Llc | $40,000 |
Source: Public Records
Tax History Compared to Growth
Tax History
| Year | Tax Paid | Tax Assessment Tax Assessment Total Assessment is a certain percentage of the fair market value that is determined by local assessors to be the total taxable value of land and additions on the property. | Land | Improvement |
|---|---|---|---|---|
| 2025 | $2,750 | $96,400 | $20,700 | $75,700 |
| 2024 | $2,388 | $88,100 | $18,300 | $69,800 |
| 2023 | $2,388 | $82,400 | $17,700 | $64,700 |
| 2022 | $2,388 | $75,100 | $16,300 | $58,800 |
| 2021 | $2,349 | $71,900 | $15,400 | $56,500 |
| 2020 | $2,349 | $71,100 | $12,700 | $58,400 |
| 2019 | $0 | $61,000 | $11,700 | $49,300 |
| 2018 | $0 | $54,200 | $12,500 | $41,700 |
| 2017 | $0 | $53,100 | $12,100 | $41,000 |
| 2016 | $0 | $54,300 | $10,450 | $43,850 |
| 2015 | -- | $54,300 | $10,450 | $43,850 |
| 2014 | -- | $53,600 | $9,450 | $44,150 |
| 2013 | -- | $49,550 | $9,450 | $40,100 |
Source: Public Records
Map
Nearby Homes
- 3535 Willyard
- 3559 Lincoln Rd
- 4812 Green Meadow Ct
- 3560 Woodfield Ct
- 3446 Riverwalk Dr Unit 58
- 3480 Riverwalk Dr
- 4494 Meadow Pond Way Unit 68
- 4421 135th Ave
- 4624 132nd Ave
- 4525 132nd Ave
- 3459 44th St
- 5014 136th Ave
- 4282 131st Ave
- 3534 41st St
- 3104 53rd St
- 3464 Jeffrey Spur Unit 11
- 3481 Jeffrey Spur
- 3479 Jeffrey Spur
- 5569 136th Ave
- 5327 128th Ave