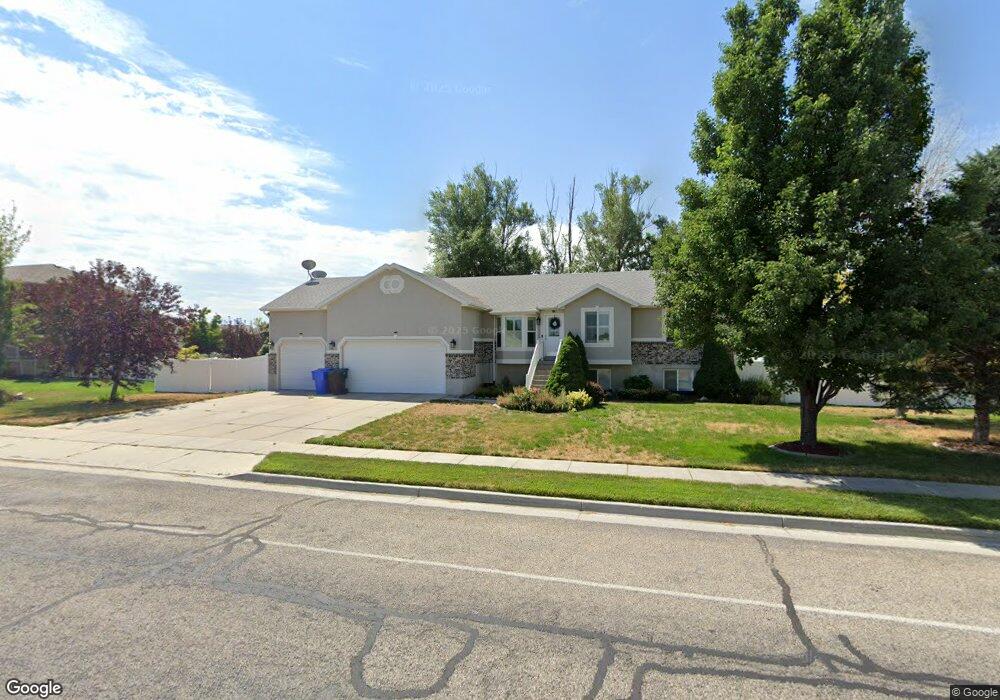
4689 W 300 N West Point, UT 84015
Estimated Value: $552,000 - $621,000
4
Beds
3
Baths
2,720
Sq Ft
$217/Sq Ft
Est. Value
About This Home
This home is located at 4689 W 300 N, West Point, UT 84015 and is currently estimated at $590,651, approximately $217 per square foot. 4689 W 300 N is a home located in Davis County with nearby schools including West Point School, West Point Junior High School, and Syracuse High School.
Ownership History
Date
Name
Owned For
Owner Type
Purchase Details
Closed on
Apr 28, 2022
Sold by
Basham William L and Basham Juliet A
Bought by
Lueken Anton K and Buelte Megan Elizabeth
Current Estimated Value
Home Financials for this Owner
Home Financials are based on the most recent Mortgage that was taken out on this home.
Original Mortgage
$430,000
Outstanding Balance
$404,623
Interest Rate
4.42%
Mortgage Type
Balloon
Estimated Equity
$186,028
Purchase Details
Closed on
Mar 13, 2012
Sold by
Basham William L and Basham Juliet A
Bought by
Basham William L and Basham Juliet A
Purchase Details
Closed on
Sep 30, 2008
Sold by
Fulghum Jeffery S and Fulghum Alisa S
Bought by
Basham William L and Basham Juliet A
Home Financials for this Owner
Home Financials are based on the most recent Mortgage that was taken out on this home.
Original Mortgage
$227,260
Interest Rate
6.43%
Mortgage Type
VA
Purchase Details
Closed on
Aug 1, 2005
Sold by
Spartan Paice Farms Llc
Bought by
Fulghum Jeffery S and Fulghum Alisa S
Home Financials for this Owner
Home Financials are based on the most recent Mortgage that was taken out on this home.
Original Mortgage
$168,850
Interest Rate
5.56%
Mortgage Type
FHA
Create a Home Valuation Report for This Property
The Home Valuation Report is an in-depth analysis detailing your home's value as well as a comparison with similar homes in the area
Home Values in the Area
Average Home Value in this Area
Purchase History
| Date | Buyer | Sale Price | Title Company |
|---|---|---|---|
| Lueken Anton K | -- | Old Republic Title | |
| Basham William L | -- | Advanced Title Ins Ag | |
| Basham William L | -- | Equity Title Ins Agency Inc | |
| Fulghum Jeffery S | -- | Bonneville Title Company |
Source: Public Records
Mortgage History
| Date | Status | Borrower | Loan Amount |
|---|---|---|---|
| Open | Lueken Anton K | $430,000 | |
| Previous Owner | Basham William L | $227,260 | |
| Previous Owner | Fulghum Jeffery S | $168,850 |
Source: Public Records
Tax History Compared to Growth
Tax History
| Year | Tax Paid | Tax Assessment Tax Assessment Total Assessment is a certain percentage of the fair market value that is determined by local assessors to be the total taxable value of land and additions on the property. | Land | Improvement |
|---|---|---|---|---|
| 2025 | $3,257 | $299,750 | $115,457 | $184,293 |
| 2024 | $3,130 | $289,300 | $103,932 | $185,368 |
| 2023 | $2,895 | $492,000 | $130,338 | $361,662 |
| 2022 | $3,145 | $292,601 | $68,019 | $224,582 |
| 2021 | $173 | $402,000 | $105,422 | $296,578 |
| 2020 | $2,127 | $350,000 | $88,719 | $261,281 |
| 2019 | $2,127 | $336,000 | $86,028 | $249,972 |
| 2018 | $0 | $306,000 | $85,690 | $220,310 |
| 2016 | $2,003 | $139,646 | $33,171 | $106,475 |
| 2015 | $2,013 | $132,991 | $33,171 | $99,820 |
| 2014 | $1,866 | $124,715 | $33,171 | $91,544 |
| 2013 | $1,930 | $122,387 | $32,338 | $90,049 |
Source: Public Records
Map
Nearby Homes
- 4594 W 75 N Unit 405
- 4669 W 75 N
- 128 N 4500 W
- 477 N 4500 W
- 4352 W 300 N
- 4366 W 200 N
- 4719 W 650 N
- 4325 W 75 N
- 120 N 4325 W
- 4362 West St Unit 106
- 4358 West St Unit 105
- 357 N 4000 W
- 356 S 4300 W Unit 611
- 364 S 4300 W Unit 610
- 3949 W 250 N
- Charleston Plan at Bluff View
- 114 3830 W
- 3851 W 50 S Unit 425
- 3849 W 50 S Unit 426
- 3847 W 50 S Unit 428
- 4692 W 250 N
- 4692 Jean Dr Unit 209
- 4717 W 300 N
- 4663 W 300 N Unit 205
- 4663 W 300 N
- 4666 Jean Dr Unit 210
- 4720 W 250 N
- 4666 W 250 N
- 4720 Jean Dr
- 4720 Jean Dr Unit 208
- 4607 Jean Dr Unit 232
- 4635 W 300 N
- 270 N 4750 W
- 4638 Jean Dr Unit 211
- 4638 W 250 N
- 4719 W 250 N
- 4659 Jean Dr Unit 230
- 222 Green Head Ln Unit 229
- 4659 W 250 N
- 4609 W 300 N