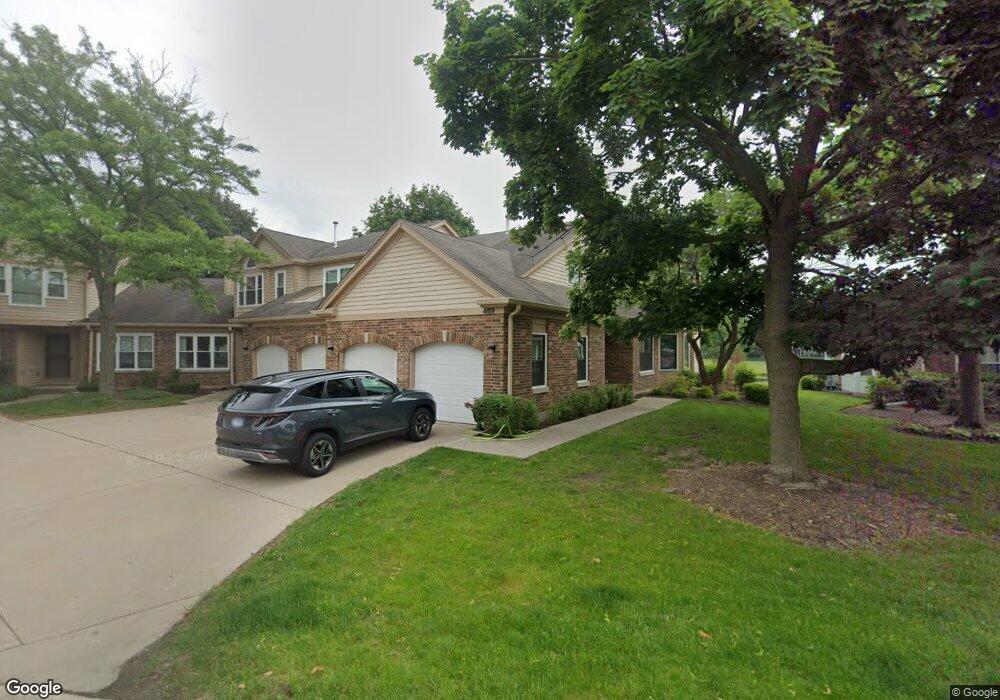
469 Banyan Tree Ln Unit 54 Buffalo Grove, IL 60089
The Woodlands of Fiore NeighborhoodEstimated Value: $442,442 - $498,000
--
Bed
3
Baths
2,129
Sq Ft
$219/Sq Ft
Est. Value
About This Home
This home is located at 469 Banyan Tree Ln Unit 54, Buffalo Grove, IL 60089 and is currently estimated at $466,611, approximately $219 per square foot. 469 Banyan Tree Ln Unit 54 is a home located in Lake County with nearby schools including Prairie Elementary School, Twin Groves Middle School, and Adlai E Stevenson High School.
Ownership History
Date
Name
Owned For
Owner Type
Purchase Details
Closed on
Apr 19, 2013
Sold by
Fielding Donald R and Fielding Marsha R
Bought by
Fielding Donald R and Fielding Marsha R
Current Estimated Value
Create a Home Valuation Report for This Property
The Home Valuation Report is an in-depth analysis detailing your home's value as well as a comparison with similar homes in the area
Home Values in the Area
Average Home Value in this Area
Purchase History
| Date | Buyer | Sale Price | Title Company |
|---|---|---|---|
| Fielding Donald R | -- | None Available |
Source: Public Records
Tax History Compared to Growth
Tax History
| Year | Tax Paid | Tax Assessment Tax Assessment Total Assessment is a certain percentage of the fair market value that is determined by local assessors to be the total taxable value of land and additions on the property. | Land | Improvement |
|---|---|---|---|---|
| 2024 | $10,910 | $130,583 | $33,817 | $96,766 |
| 2023 | $11,045 | $123,215 | $31,909 | $91,306 |
| 2022 | $11,045 | $119,161 | $30,859 | $88,302 |
| 2021 | $10,684 | $117,876 | $30,526 | $87,350 |
| 2020 | $10,477 | $118,278 | $30,630 | $87,648 |
| 2019 | $10,230 | $117,842 | $30,517 | $87,325 |
| 2018 | $9,739 | $115,713 | $33,171 | $82,542 |
| 2017 | $9,576 | $113,012 | $32,397 | $80,615 |
| 2016 | $9,204 | $108,218 | $31,023 | $77,195 |
| 2015 | $8,961 | $101,204 | $29,012 | $72,192 |
| 2014 | $7,693 | $87,161 | $31,160 | $56,001 |
| 2012 | $7,593 | $87,335 | $31,222 | $56,113 |
Source: Public Records
Map
Nearby Homes
- 361 Willow Pkwy Unit 234
- 259 Willow Pkwy Unit 403
- 486 Satinwood Terrace Unit 11
- 2770 Sandalwood Rd Unit 3
- 333 Didier Ct
- 61 Willow Pkwy Unit 731
- 1998 Sheridan Ct
- 321 Foxford Dr
- 361 Hoffmann Dr
- 268 Hoffmann Dr
- 1901 Brandywyn Ln
- 10 Chestnut Ct E
- 16637 W Brockman Ave
- 5 Willow Pkwy Unit 892
- 1903 Sheridan Rd
- 2033 Olive Hill Dr
- 16639 W Brockman Ave
- 2071 Wright Blvd
- 2861 Whispering Oaks Dr
- 4 Daybreak Terrace
- 467 Banyan Tree Ln Unit 53
- 473 Banyan Tree Ln Unit 41
- 465 Banyan Tree Ln Unit 52
- 463 Banyan Tree Ln Unit 51
- 475 Banyan Tree Ln Unit 42
- 460 Banyan Tree Ln Unit 61
- 479 Banyan Tree Ln Unit 31
- 466 Banyan Tree Ln Unit 72
- 468 Banyan Tree Ln Unit 71
- 478 Banyan Tree Ln Unit 81
- 481 Banyan Tree Ln Unit 32
- 472 Banyan Tree Ln Unit 84
- 476 Banyan Tree Ln Unit 82
- 474 Banyan Tree Ln Unit 83
- 474 Banyan Tree Ln Unit 474
- 483 Banyan Tree Ln Unit 33
- 480 Banyan Tree Ln Unit 93
- 482 Banyan Tree Ln Unit 94
- 487 Banyan Tree Ln Unit 21
- 489 Banyan Tree Ln Unit 22