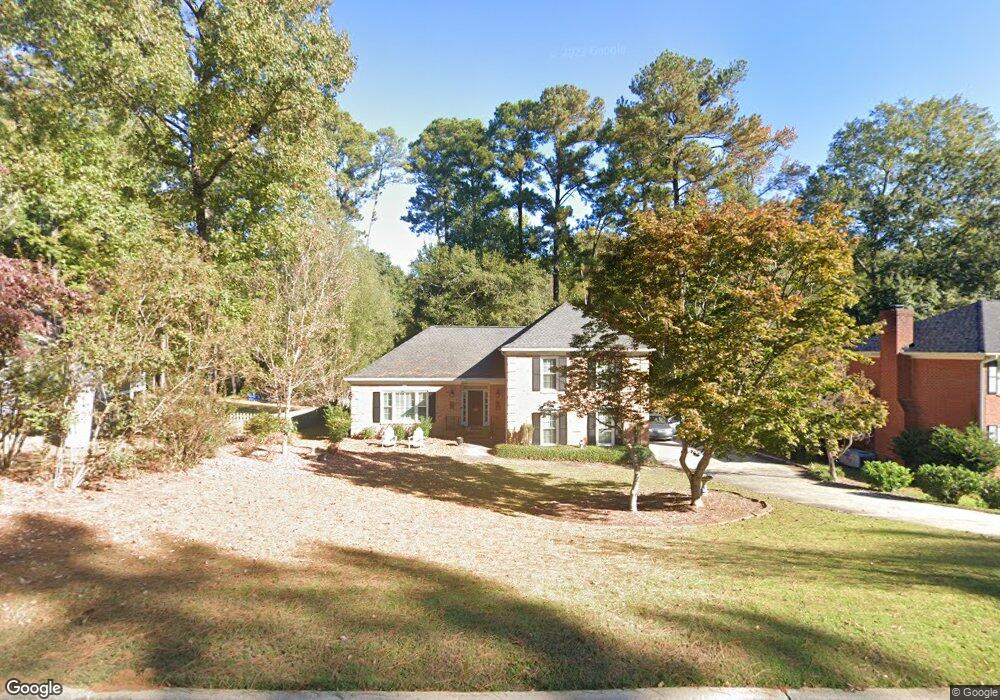
469 Cambridge Way Augusta, GA 30907
Estimated Value: $406,523 - $443,000
3
Beds
3
Baths
2,650
Sq Ft
$161/Sq Ft
Est. Value
About This Home
This home is located at 469 Cambridge Way, Augusta, GA 30907 and is currently estimated at $426,881, approximately $161 per square foot. 469 Cambridge Way is a home located in Columbia County with nearby schools including Stevens Creek Elementary School, Stallings Island Middle School, and Lakeside High School.
Ownership History
Date
Name
Owned For
Owner Type
Purchase Details
Closed on
Dec 15, 2022
Sold by
Morgan David H
Bought by
Morgan Stacy D
Current Estimated Value
Purchase Details
Closed on
Nov 23, 2015
Sold by
Brooks Stacy
Bought by
Morgan Stacy D and Morgan David H
Purchase Details
Closed on
Jun 5, 2009
Sold by
Holmes Luvenia
Bought by
Brooks Stacy
Home Financials for this Owner
Home Financials are based on the most recent Mortgage that was taken out on this home.
Original Mortgage
$200,000
Interest Rate
4.77%
Mortgage Type
New Conventional
Create a Home Valuation Report for This Property
The Home Valuation Report is an in-depth analysis detailing your home's value as well as a comparison with similar homes in the area
Home Values in the Area
Average Home Value in this Area
Purchase History
| Date | Buyer | Sale Price | Title Company |
|---|---|---|---|
| Morgan Stacy D | -- | -- | |
| Morgan Stacy D | -- | -- | |
| Brooks Stacy | $234,000 | -- |
Source: Public Records
Mortgage History
| Date | Status | Borrower | Loan Amount |
|---|---|---|---|
| Previous Owner | Brooks Stacy | $200,000 |
Source: Public Records
Tax History Compared to Growth
Tax History
| Year | Tax Paid | Tax Assessment Tax Assessment Total Assessment is a certain percentage of the fair market value that is determined by local assessors to be the total taxable value of land and additions on the property. | Land | Improvement |
|---|---|---|---|---|
| 2025 | $3,705 | $154,870 | $26,004 | $128,866 |
| 2024 | $3,756 | $149,958 | $30,504 | $119,454 |
| 2023 | $3,756 | $126,974 | $26,204 | $100,770 |
| 2022 | $3,079 | $116,268 | $22,904 | $93,364 |
| 2021 | $2,673 | $96,175 | $18,804 | $77,371 |
| 2020 | $2,726 | $96,077 | $20,504 | $75,573 |
| 2019 | $2,637 | $92,892 | $19,404 | $73,488 |
| 2018 | $2,485 | $87,114 | $18,704 | $68,410 |
| 2017 | $2,743 | $96,028 | $18,604 | $77,424 |
| 2016 | $2,450 | $88,735 | $17,280 | $71,455 |
| 2015 | $2,366 | $85,455 | $16,980 | $68,475 |
| 2014 | $2,260 | $80,498 | $15,280 | $65,218 |
Source: Public Records
Map
Nearby Homes
- 466 Cambridge Way
- 482 Cambridge Way
- 615 Stevens Crossing
- 3531 W Lake Dr
- 3526 W Lake Dr
- 3553 Pebble Beach Dr
- 3507 Lost Tree Ln
- 3667 Foxfire Place
- 3506 Lost Tree Ln
- 3587 Oakmont Ct
- 4120 Shady Oaks Dr
- 307 Old Salem Way
- 3521 Pebble Beach Dr
- 271 Watervale Rd
- 3710 Inverness Way
- 3555 Watervale Way
- 3810 Inverness Way
- 1119 Hampstead Place
- 333 Old Salem Way
- 3637 Foxfire Place
- 467 Cambridge Way
- 471 Cambridge Way
- 465 Cambridge Way
- 456 Cambridge Way
- 473 Cambridge Way
- 421 Hastings Place
- 460 Cambridge Way
- 475 Cambridge Way
- 419 Hastings Place
- 464 Cambridge Way
- 417 Hastings Place
- 477 Cambridge Way
- 418 Hastings Place
- 459 Cambridge Way
- 415 Hastings Place
- 479 Cambridge Way
- 416 Hastings Place
- 446 Cambridge Way
- 483 Cambridge Way
- 468 Cambridge Way