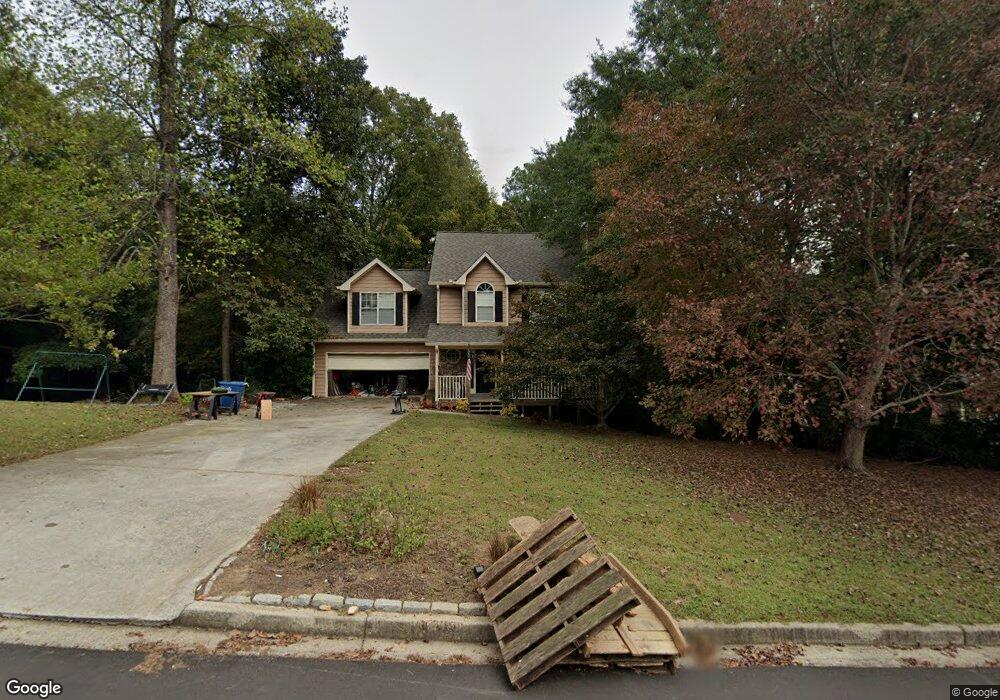
469 Creek Crossing Ct Unit 2 Grayson, GA 30017
Estimated Value: $343,000 - $378,000
3
Beds
3
Baths
1,887
Sq Ft
$194/Sq Ft
Est. Value
About This Home
This home is located at 469 Creek Crossing Ct Unit 2, Grayson, GA 30017 and is currently estimated at $365,170, approximately $193 per square foot. 469 Creek Crossing Ct Unit 2 is a home located in Gwinnett County with nearby schools including W.J. Cooper Elementary School, McConnell Middle School, and Archer High School.
Ownership History
Date
Name
Owned For
Owner Type
Purchase Details
Closed on
May 22, 2003
Sold by
Patch Christopher B and Patch Julia R
Bought by
Davis Joseph B and Davis Clarissa
Current Estimated Value
Home Financials for this Owner
Home Financials are based on the most recent Mortgage that was taken out on this home.
Original Mortgage
$152,000
Outstanding Balance
$65,629
Interest Rate
5.7%
Mortgage Type
New Conventional
Estimated Equity
$299,541
Purchase Details
Closed on
Dec 10, 2001
Sold by
Patch Christopher B
Bought by
Patch Christopher B and Patch Julia R
Home Financials for this Owner
Home Financials are based on the most recent Mortgage that was taken out on this home.
Original Mortgage
$93,850
Interest Rate
6.42%
Mortgage Type
New Conventional
Purchase Details
Closed on
Sep 11, 1995
Sold by
Stanley Wrightconst Inc
Bought by
Patch Christopher B
Create a Home Valuation Report for This Property
The Home Valuation Report is an in-depth analysis detailing your home's value as well as a comparison with similar homes in the area
Home Values in the Area
Average Home Value in this Area
Purchase History
| Date | Buyer | Sale Price | Title Company |
|---|---|---|---|
| Davis Joseph B | $152,000 | -- | |
| Patch Christopher B | -- | -- | |
| Patch Christopher B | $114,400 | -- |
Source: Public Records
Mortgage History
| Date | Status | Borrower | Loan Amount |
|---|---|---|---|
| Open | Davis Joseph B | $152,000 | |
| Previous Owner | Patch Christopher B | $93,850 | |
| Closed | Patch Christopher B | $0 |
Source: Public Records
Tax History Compared to Growth
Tax History
| Year | Tax Paid | Tax Assessment Tax Assessment Total Assessment is a certain percentage of the fair market value that is determined by local assessors to be the total taxable value of land and additions on the property. | Land | Improvement |
|---|---|---|---|---|
| 2024 | $5,148 | $132,680 | $24,000 | $108,680 |
| 2023 | $5,148 | $135,360 | $26,000 | $109,360 |
| 2022 | $4,728 | $121,840 | $22,800 | $99,040 |
| 2021 | $3,918 | $97,840 | $16,800 | $81,040 |
| 2020 | $3,533 | $86,640 | $16,800 | $69,840 |
| 2019 | $3,262 | $82,680 | $16,800 | $65,880 |
| 2018 | $3,001 | $75,200 | $15,040 | $60,160 |
| 2016 | $2,831 | $69,840 | $13,200 | $56,640 |
| 2015 | $2,654 | $64,160 | $12,000 | $52,160 |
| 2014 | -- | $53,240 | $10,800 | $42,440 |
Source: Public Records
Map
Nearby Homes
- 489 Creek Crossing Ct
- 459 Creek Crossing Ct
- 474 Creek Crossing Ct
- 464 Creek Crossing Ct Unit 2
- 499 Creek Crossing Ct Unit 2
- 484 Creek Crossing Ct
- 454 Creek Crossing Ct
- 409 Creek Crossing Ct
- 494 Creek Crossing Ct
- 444 Creek Crossing Ct
- 434 Creek Crossing Ct Unit 2
- 434 Creek Crossing Ct
- 0 Creek Crossing Ct Unit 7200532
- 0 Creek Crossing Ct Unit 7208188
- 0 Creek Crossing Ct Unit 3184830
- 0 Creek Crossing Ct Unit 8683426
- 0 Creek Crossing Ct Unit 8593995
- 0 Creek Crossing Ct Unit 8426806
- 0 Creek Crossing Ct Unit 8279398
- 0 Creek Crossing Ct Unit 8191725