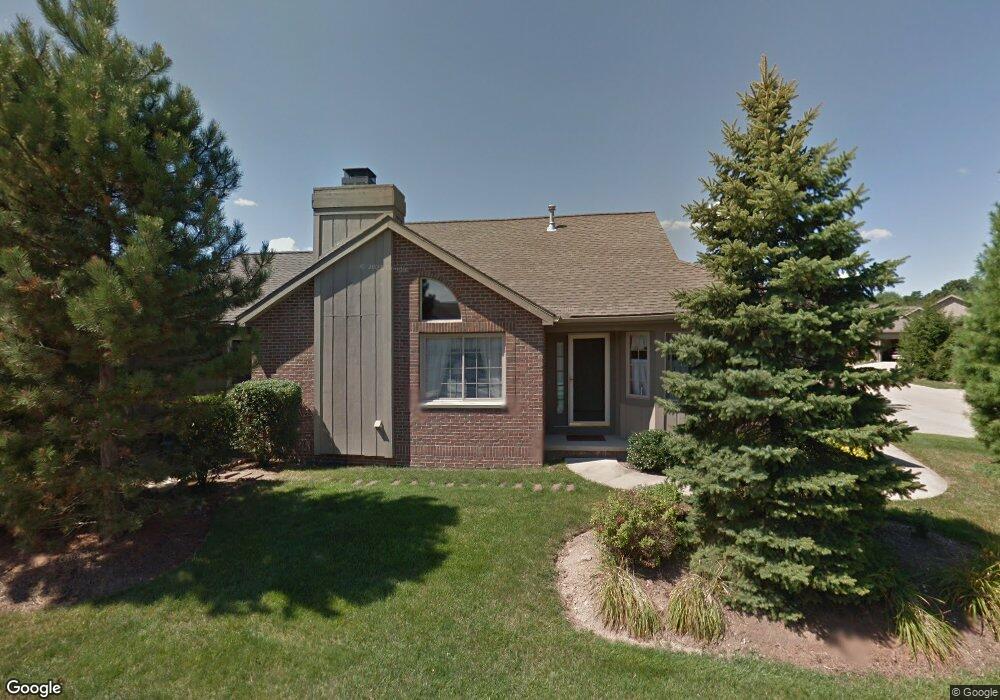
469 Dottie Ct Unit 86 Tallmadge, OH 44278
Estimated Value: $278,000 - $289,000
3
Beds
2
Baths
1,582
Sq Ft
$178/Sq Ft
Est. Value
About This Home
This home is located at 469 Dottie Ct Unit 86, Tallmadge, OH 44278 and is currently estimated at $282,193, approximately $178 per square foot. 469 Dottie Ct Unit 86 is a home located in Summit County with nearby schools including Tallmadge Middle School, Tallmadge High School, and Middlebury Academy.
Ownership History
Date
Name
Owned For
Owner Type
Purchase Details
Closed on
Jun 1, 2018
Sold by
Taylor James W and Taylor Geraldine K
Bought by
Zeller Michele Criswell and Johnson John E
Current Estimated Value
Purchase Details
Closed on
Oct 31, 2016
Sold by
Mason Cynthia A
Bought by
Taylor James W and Taylor Geraldine K
Home Financials for this Owner
Home Financials are based on the most recent Mortgage that was taken out on this home.
Original Mortgage
$120,000
Interest Rate
3.5%
Mortgage Type
Unknown
Purchase Details
Closed on
Sep 13, 2016
Sold by
Mason Elizabeth L
Bought by
Mason Cynthia A and The Elizabeth L Mason Irrevocable Trust
Home Financials for this Owner
Home Financials are based on the most recent Mortgage that was taken out on this home.
Original Mortgage
$120,000
Interest Rate
3.5%
Mortgage Type
Unknown
Purchase Details
Closed on
Nov 2, 2001
Sold by
Robin Ridge Development Co
Bought by
Mason Robert E and Mason Elizabeth L
Create a Home Valuation Report for This Property
The Home Valuation Report is an in-depth analysis detailing your home's value as well as a comparison with similar homes in the area
Home Values in the Area
Average Home Value in this Area
Purchase History
| Date | Buyer | Sale Price | Title Company |
|---|---|---|---|
| Zeller Michele Criswell | $192,000 | Village Title Agency Llc | |
| Taylor James W | $155,000 | Village Title | |
| Mason Cynthia A | -- | None Available | |
| Mason Robert E | $168,900 | Endress/Lawyers Title |
Source: Public Records
Mortgage History
| Date | Status | Borrower | Loan Amount |
|---|---|---|---|
| Previous Owner | Taylor James W | $120,000 |
Source: Public Records
Tax History Compared to Growth
Tax History
| Year | Tax Paid | Tax Assessment Tax Assessment Total Assessment is a certain percentage of the fair market value that is determined by local assessors to be the total taxable value of land and additions on the property. | Land | Improvement |
|---|---|---|---|---|
| 2025 | $3,804 | $85,418 | $8,722 | $76,696 |
| 2024 | $3,804 | $85,418 | $8,722 | $76,696 |
| 2023 | $3,804 | $85,418 | $8,722 | $76,696 |
| 2022 | $3,210 | $61,352 | $6,230 | $55,122 |
| 2021 | $3,225 | $61,352 | $6,230 | $55,122 |
| 2020 | $3,199 | $61,350 | $6,230 | $55,120 |
| 2019 | $2,923 | $51,720 | $6,100 | $45,620 |
| 2018 | $3,100 | $51,730 | $6,120 | $45,610 |
| 2017 | $2,212 | $50,500 | $6,200 | $44,300 |
| 2016 | $2,387 | $45,370 | $6,200 | $39,170 |
| 2015 | $2,212 | $45,370 | $6,200 | $39,170 |
| 2014 | $2,197 | $45,370 | $6,200 | $39,170 |
| 2013 | $2,444 | $50,220 | $6,200 | $44,020 |
Source: Public Records
Map
Nearby Homes
- 500 Dottie Ct Unit 109
- 130 Strecker Dr
- 2333 Eastwood Ave
- 2330 Eastwood Ave
- 2354 Savoy Ave
- 689 Alaho St
- 464 Carruthers Rd
- 77 Northwood Ln
- 353 Southeast Ave
- 313 Southeast Ave
- 331 Southeast Ave
- 572 Eastglen Cir
- 75 Glenwood Cir
- 261 van Evera Rd
- 505 Moody St
- 2253 Tyro Ave
- 469 Lodi St
- 685 Beechview Dr
- 758 Humble Rd
- 459 Alaho St
- 473 Dottie Ct
- 502 Treasure Ln Unit 87
- 493 Treasure Ln Unit 99
- 497 Treasure Ln Unit 98
- 497 Dottie Ct Unit 84
- 487 Treasure Ln
- 468 Dottie Ct Unit 102
- 506 Treasure Ln Unit 88
- 503 Treasure Ln Unit 97
- 472 Dottie Ct Unit 103
- 501 Dottie Ct Unit 83
- 478 Dottie Ct Unit 104
- 483 Treasure Ln Unit 101
- 482 Dottie Ct Unit 105
- 507 Treasure Ln Unit 96
- 486 Dottie Ct Unit 106
- 492 Dottie Ct
- 512 Treasure Ln Unit 89
- 496 Dottie Ct Unit 108
- 477 Treasure Ln Unit 120