Estimated Value: $425,000 - $438,000
3
Beds
2
Baths
2,255
Sq Ft
$192/Sq Ft
Est. Value
About This Home
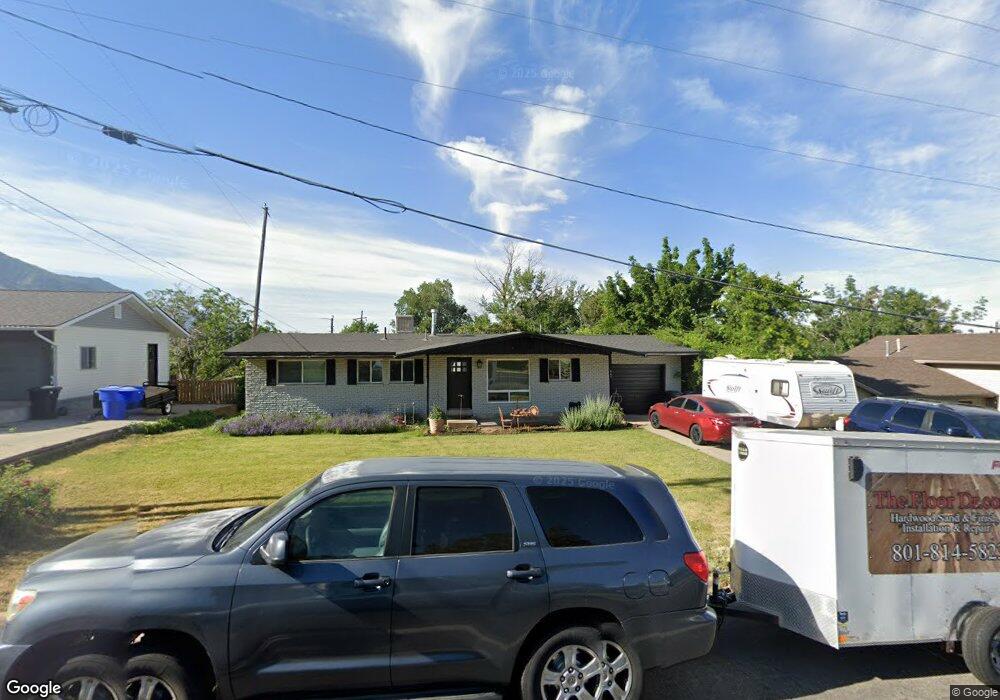
This home is located at 469 E 3100 N, Ogden, UT 84414 and is currently estimated at $432,061, approximately $191 per square foot. 469 E 3100 N is a home located in Weber County with nearby schools including North Ogden School, North Ogden Junior High School, and Weber High School.
Ownership History
Date
Name
Owned For
Owner Type
Purchase Details
Closed on
Mar 26, 2007
Sold by
Hud
Bought by
Hestad Micah D and Hestad Jennifer L
Current Estimated Value
Home Financials for this Owner
Home Financials are based on the most recent Mortgage that was taken out on this home.
Original Mortgage
$112,040
Outstanding Balance
$68,262
Interest Rate
6.29%
Mortgage Type
Purchase Money Mortgage
Estimated Equity
$363,799
Purchase Details
Closed on
Oct 25, 2006
Sold by
Washington Mutual Bank
Bought by
Hud
Purchase Details
Closed on
Sep 6, 2006
Sold by
Duncombe William and Fairchild Marie
Bought by
Washington Mutual Bank and Washington Mutual Bank Fa
Purchase Details
Closed on
Oct 8, 2004
Sold by
Clausse Helen B
Bought by
Duncombe William and Fairchild Marie
Create a Home Valuation Report for This Property
The Home Valuation Report is an in-depth analysis detailing your home's value as well as a comparison with similar homes in the area
Home Values in the Area
Average Home Value in this Area
Purchase History
| Date | Buyer | Sale Price | Title Company |
|---|---|---|---|
| Hestad Micah D | -- | Monument Title Insurance Inc | |
| Hud | -- | First Southwestern Title Age | |
| Washington Mutual Bank | $143,693 | First Southwestern Title Age | |
| Duncombe William | -- | Bonneville Title Company |
Source: Public Records
Mortgage History
| Date | Status | Borrower | Loan Amount |
|---|---|---|---|
| Open | Hestad Micah D | $112,040 |
Source: Public Records
Tax History
| Year | Tax Paid | Tax Assessment Tax Assessment Total Assessment is a certain percentage of the fair market value that is determined by local assessors to be the total taxable value of land and additions on the property. | Land | Improvement |
|---|---|---|---|---|
| 2025 | $2,846 | $416,420 | $139,987 | $276,433 |
| 2024 | $2,718 | $226,049 | $76,992 | $149,057 |
| 2023 | $2,587 | $218,350 | $76,946 | $141,404 |
| 2022 | $2,631 | $229,350 | $71,501 | $157,849 |
| 2021 | $2,026 | $298,000 | $75,063 | $222,937 |
| 2020 | $1,862 | $255,000 | $60,005 | $194,995 |
| 2019 | $1,775 | $233,000 | $54,901 | $178,099 |
| 2018 | $1,626 | $203,000 | $49,983 | $153,017 |
| 2017 | $1,519 | $178,000 | $49,975 | $128,025 |
| 2016 | $1,420 | $89,495 | $26,821 | $62,674 |
| 2015 | $1,420 | $89,495 | $26,821 | $62,674 |
| 2014 | $1,445 | $89,496 | $26,821 | $62,675 |
Source: Public Records
Map
Nearby Homes
- 566 E 3050 N
- 1396 W Caribou Ct Unit 110
- 1376 W Caribou Ct Unit 108
- 3642 N 800 E
- 1404 W Caribou Ct N Unit 111
- 1383 W Caribou Ct Unit 113
- 1364 W Caribou Ct Unit 107
- 1177 W 3390 N Unit 221
- 2881 N 450 E
- 679 E 3050 N
- 266 E 3250 N
- 3380 N 400 E
- 466 E 3460 N
- 2735 N 400 E
- 2912 N 750 E
- 3515 N 425 E
- 204 E Lomond View Dr
- 210 E Lomond View Dr
- 191 E 3475 N
- 658 E 3525 N
Your Personal Tour Guide
Ask me questions while you tour the home.