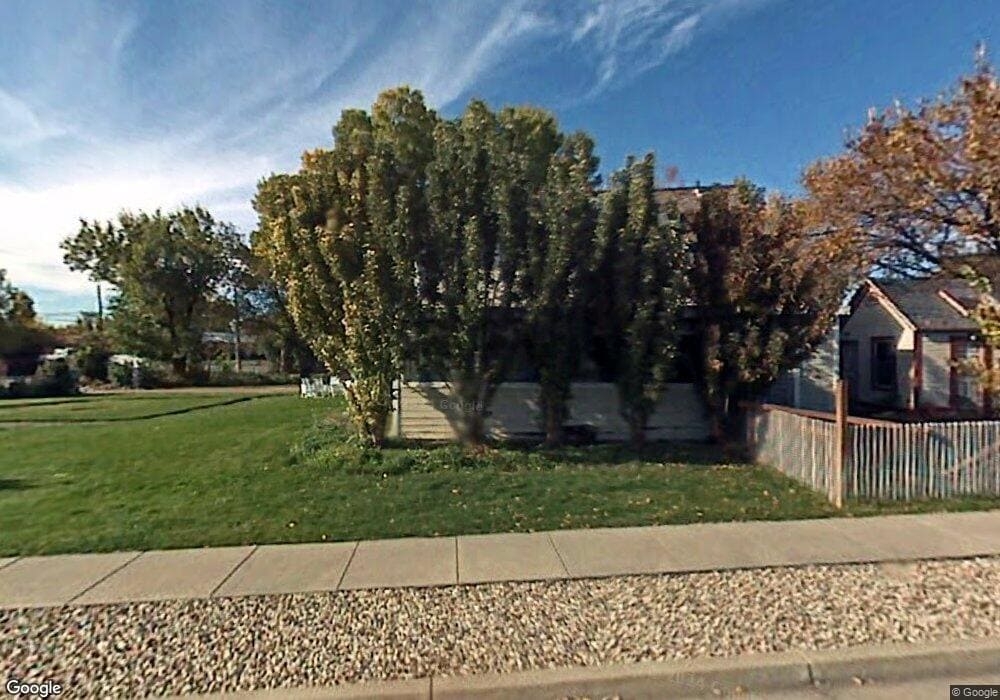
469 Flint St Layton, UT 84041
Estimated Value: $479,000 - $557,266
3
Beds
2
Baths
2,226
Sq Ft
$230/Sq Ft
Est. Value
About This Home
This home is located at 469 Flint St, Layton, UT 84041 and is currently estimated at $512,567, approximately $230 per square foot. 469 Flint St is a home located in Davis County with nearby schools including Layton Elementary School, Fairfield Junior High School, and Layton High School.
Ownership History
Date
Name
Owned For
Owner Type
Purchase Details
Closed on
Oct 19, 1999
Sold by
Adams Stanley S
Bought by
Adams Stanley S
Current Estimated Value
Home Financials for this Owner
Home Financials are based on the most recent Mortgage that was taken out on this home.
Original Mortgage
$212,500
Interest Rate
7.86%
Purchase Details
Closed on
Sep 19, 1996
Sold by
Adams Wendell E
Bought by
Adams Stanley S
Home Financials for this Owner
Home Financials are based on the most recent Mortgage that was taken out on this home.
Original Mortgage
$117,600
Interest Rate
10%
Create a Home Valuation Report for This Property
The Home Valuation Report is an in-depth analysis detailing your home's value as well as a comparison with similar homes in the area
Home Values in the Area
Average Home Value in this Area
Purchase History
| Date | Buyer | Sale Price | Title Company |
|---|---|---|---|
| Adams Stanley S | -- | Independence Title Ins Agenc | |
| Adams Stanley S | -- | Surety Title Agency |
Source: Public Records
Mortgage History
| Date | Status | Borrower | Loan Amount |
|---|---|---|---|
| Closed | Adams Stanley S | $212,500 | |
| Closed | Adams Stanley S | $117,600 |
Source: Public Records
Tax History
| Year | Tax Paid | Tax Assessment Tax Assessment Total Assessment is a certain percentage of the fair market value that is determined by local assessors to be the total taxable value of land and additions on the property. | Land | Improvement |
|---|---|---|---|---|
| 2025 | $2,699 | $283,250 | $175,109 | $108,141 |
| 2024 | $2,585 | $273,350 | $172,646 | $100,704 |
| 2023 | $2,350 | $438,000 | $239,568 | $198,432 |
| 2022 | $2,532 | $256,300 | $116,553 | $139,747 |
| 2021 | $2,279 | $344,000 | $174,640 | $169,360 |
| 2020 | $2,085 | $302,000 | $155,182 | $146,818 |
| 2019 | $1,953 | $277,000 | $139,115 | $137,885 |
| 2018 | $1,763 | $251,000 | $124,122 | $126,878 |
| 2016 | $1,434 | $105,325 | $59,501 | $45,824 |
| 2015 | $1,264 | $88,110 | $59,501 | $28,609 |
| 2014 | $1,363 | $97,164 | $59,501 | $37,663 |
| 2013 | -- | $92,241 | $37,853 | $54,388 |
Source: Public Records
Map
Nearby Homes
Your Personal Tour Guide
Ask me questions while you tour the home.